FMEA is not a formality a classification society asks for. It is a way of finding out, before steel is cut, which failures the design has not yet thought about.
Chapter 1: Introduction
The High Stakes of Shipbuilding
A ship is a floating city. It carries thousands of tonnes of steel, miles of piping, hundreds of kilometres of electrical cable, and a crew that depends on every one of those systems working together. When a bulk carrier loses propulsion in heavy weather, when a passenger ferry experiences a blackout during docking, or when an offshore supply vessel drifts off station, the consequences are not measured in lost production hours alone. They are measured in lives, environmental damage, and the reputational collapse of the yard that built the vessel and the operator that sails it.
Shipbuilding is unusual among manufacturing industries because almost nothing is truly mass-produced. Even when a yard builds a series of sister ships, each hull is assembled in a different sequence, by different teams, under different weather conditions, with supply chains that shift from one vessel to the next. A defect that is merely inconvenient in automotive assembly, such as a poorly fitted door panel, can become catastrophic in shipbuilding. A weld that lacks penetration in a hull block might not fail during sea trials. It might fail three years later in a Force 9 gale. A valve installed backwards in a fuel oil transfer line might sit unnoticed until the moment it is needed most.
This is the world in which Failure Mode and Effects Analysis, or FMEA, does its work. FMEA is not a software package or a quality department checklist. It is a disciplined way of thinking that asks a simple question before anything goes wrong: what could fail here, and what would happen if it did? In shipbuilding, that question is asked at every stage, from the first lines on a naval architect's drawing board to the final sea trials and beyond into the vessel's operational life.
The purpose of this essay is to examine how FMEA is actually used in the shipbuilding industry, not in theory but in the shipyard, the design office, and the classification society's review process. It draws on documented case studies from shipyards in Türkiye, Indonesia, and elsewhere, and it explains how the methodology has evolved from a military reliability tool into a central pillar of maritime risk management. The scope covers hull structure production, machinery and piping systems, dynamic positioning, and the emerging integration of FMEA with data-driven methods such as Bayesian networks and machine learning.
But before any of that can make sense, it is necessary to understand where FMEA came from and why it took hold in the maritime world when it did. The history is not merely background. It explains why FMEA looks the way it does, why it is structured around severity, occurrence, and detection, and why classification societies treat it as something more than a bureaucratic formality.
The Origins of FMEA: From Military Procedure to Engineering Discipline
The story of FMEA begins in the late 1940s, in the aftermath of the Second World War. The United States military had learned hard lessons about equipment reliability during the war. Weapons systems, aircraft, and naval vessels had failed in service not because of enemy action but because of design flaws that could have been anticipated. The military needed a systematic method for identifying how equipment could fail and what the consequences of those failures would be.
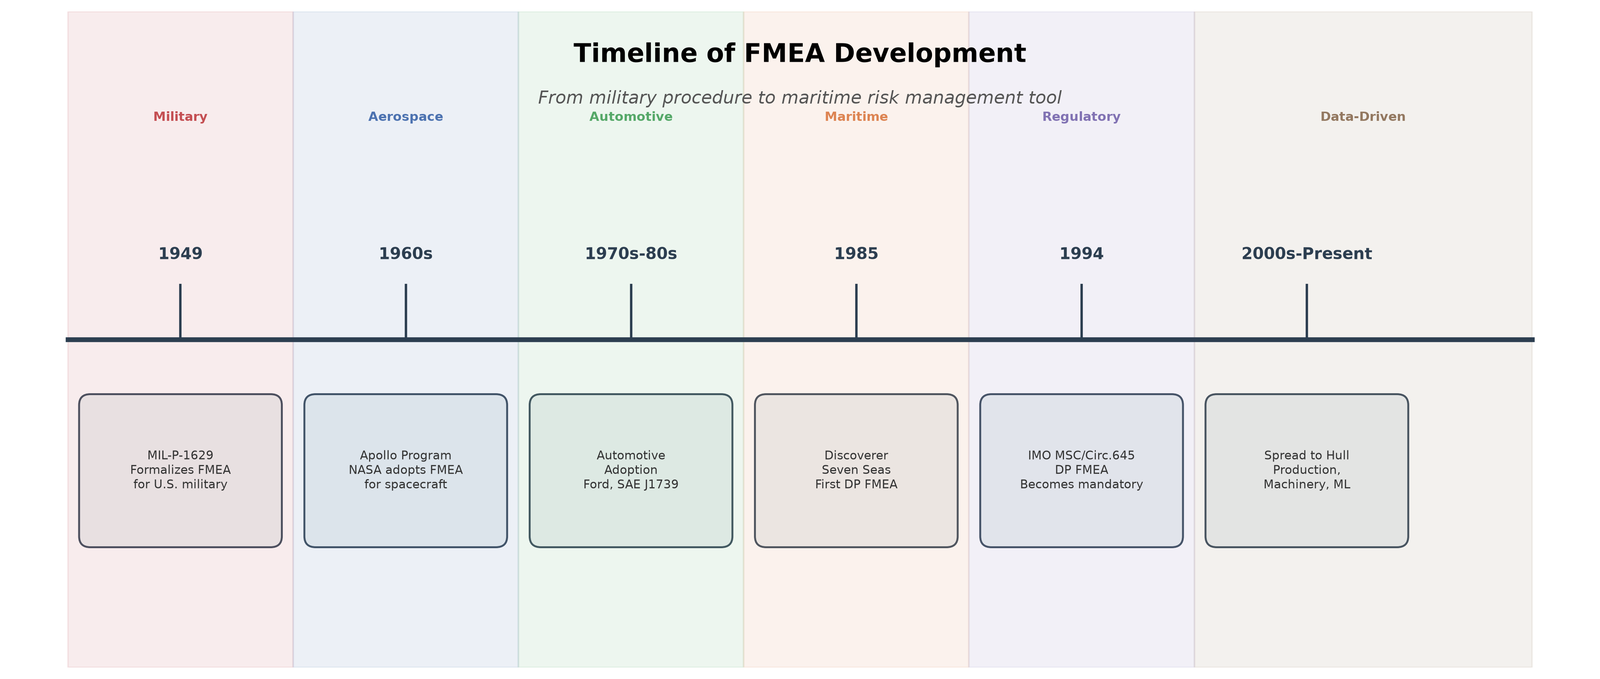
In 1949, the U.S. armed forces issued Military Procedure MIL-P-1629, titled "Procedures for Performing a Failure Mode, Effects and Criticality Analysis." This document formalized a technique that had been developing informally in military engineering circles. The procedure required analysts to break a system down into its components, identify every plausible way each component could fail, trace the effects of that failure upward through the system, and classify the severity of the consequences according to their impact on mission success and personnel safety.
The logic was straightforward. If you could identify a failure mode before it occurred in the field, you could redesign the system, add redundancy, or establish inspection procedures to catch the failure before it became critical. FMEA was, in essence, organized suspicion. It assumed that things would break and asked what would happen when they did.
For roughly two decades, FMEA remained largely confined to military and aerospace applications. The technique was refined through the 1950s as the Cold War drove investment in missile systems, radar, and aircraft. But the event that pushed FMEA into a wider engineering consciousness was the Apollo program. In the early 1960s, NASA adopted FMEA as a central tool for assessing the reliability of spacecraft systems. The Apollo fire in 1967, which killed three astronauts during a ground test, underscored the consequences of unexamined failure modes. NASA responded by strengthening its system safety programs and embedding FMEA more deeply into its design review process.
The Apollo program demonstrated something important about FMEA: it worked best when it was applied early, before physical hardware existed. A failure mode identified on a drawing could be corrected with a pencil stroke. The same failure mode discovered during assembly might require scrapping a completed component. This principle, that FMEA has the greatest leverage in the earliest stages of design, would later become central to its application in shipbuilding.
The 1970s and 1980s saw FMEA spread beyond aerospace into other industries. The automotive sector was the most significant adopter. Ford Motor Company was among the first to use FMEA systematically, driven by the need to improve vehicle reliability and reduce warranty claims. The automotive industry's version of FMEA evolved differently from the military model. It placed greater emphasis on process FMEA, which examined not only how a product could fail but how the manufacturing process itself could introduce defects. The joint efforts of several automotive manufacturers eventually produced the industry standard SAE J1739, published in 1994, which codified FMEA practice for the sector.
By the time FMEA reached the maritime industry, it had already been tested in environments where failure meant catastrophe. The question was not whether the technique was useful. The question was how to adapt it to an industry where products are built in ones and twos, where the production process spans years rather than hours, and where the operating environment is as unforgiving as anything in aerospace.
FMEA Enters the Maritime World
The maritime industry's adoption of FMEA was driven by a specific problem: dynamic positioning. In the 1970s and 1980s, offshore oil and gas exploration moved into deeper waters, particularly in the North Sea. Conventional anchoring systems could not hold drilling vessels on station in those depths and conditions. Dynamic positioning, or DP, systems used computer-controlled thrusters to maintain a vessel's position without anchors.
The reliability requirements for DP were extreme. A drilling vessel that lost position could sever a wellhead, causing a blowout with catastrophic environmental and human consequences. Redundancy was essential, but redundancy alone was not enough. The vessel's designers needed to prove that no single failure could cause a loss of position and that the remaining systems could compensate for any credible failure.
This is where FMEA found its maritime home. The technique was already well-established in military and aerospace reliability engineering, and it mapped naturally onto the DP problem. An FMEA for a DP system would break the system down into its components, such as thrusters, generators, switchboards, control computers, and sensors, and ask what would happen if each one failed. It would then assess whether the remaining redundant components could maintain position and heading.
The first documented application of FMEA to improve DP reliability occurred in 1985 on the drillship Discoverer Seven Seas. The analysis identified failure modes that had not been apparent from the system's design documentation and led to modifications that improved the vessel's station-keeping reliability. The results were convincing enough that the approach spread. In 1991, the Dynamic Positioned Vessel Owners Association published guidelines for the design and operation of DP vessels, which explicitly cited FMEA as the technique for demonstrating redundancy.
The regulatory framework followed quickly. In 1994, the International Maritime Organization issued MSC Circular 645, which established FMEA as the primary means of identifying failure modes for DP systems. Classification societies, including the American Bureau of Shipping, Det Norske Veritas, and Lloyd's Register, subsequently incorporated FMEA into their DP class notation requirements. For a vessel to receive a DP 2 or DP 3 notation, which indicates progressively higher levels of redundancy, the owner or builder had to submit an FMEA that demonstrated compliance with the class society's rules.
This was a turning point. FMEA moved from a voluntary reliability tool to a mandatory component of classification. Shipyards and design offices that had never performed a formal FMEA suddenly had to develop the capability. The learning curve was steep, and the quality of early DP FMEAs varied considerably.
From Dynamic Positioning to the Whole Ship
The initial maritime applications of FMEA were narrowly focused on DP systems. But the logic of the method could not be contained. If FMEA could identify failure modes in a thruster control system, it could identify failure modes in a fuel oil system, a seawater cooling loop, or the hull structure itself. Through the 2000s and 2010s, FMEA spread across the shipbuilding process.
Two developments accelerated this expansion. First, classification societies began requiring FMEA for an increasing range of systems beyond DP. Vessels with hazardous cargoes, such as LNG carriers and chemical tankers, needed to demonstrate that their containment and transfer systems could tolerate failures without releasing dangerous substances. FMEA became a standard part of the safety case for these vessels. Second, the shipbuilding industry itself began to recognize that FMEA could improve production quality and reduce rework. A welding FMEA, for example, could identify the conditions most likely to produce defective welds and establish inspection regimes to catch them before the block was assembled into the hull.
The scope of FMEA in shipbuilding today is broad. It covers design-level analysis of propulsion and electrical systems, process-level analysis of welding and block erection, and operational analysis of machinery and safety systems. It is used by naval architects at the concept stage, by production engineers during construction, and by classification surveyors during verification. The following chapters will examine each of these applications in detail, drawing on case studies that show how FMEA works in practice rather than in principle.
But before moving to those applications, it is worth pausing on one point. FMEA is not a guarantee. It is a method for making risk visible. A well-conducted FMEA will not eliminate all failures. It will, however, ensure that the most serious failure modes are identified, understood, and either designed out or mitigated. In an industry where the cost of failure is measured in lives and livelihoods, that is not a small thing.
A Note on Terminology
Throughout this essay, the terms FMEA and FMECA appear. FMEA stands for Failure Mode and Effects Analysis. FMECA stands for Failure Mode, Effects, and Criticality Analysis. The difference is that FMECA includes a criticality assessment, which ranks failure modes by their combined severity and probability. In practice, the distinction is often blurred. Many maritime FMEAs include criticality rankings, and many FMECAs are referred to simply as FMEAs. Unless the distinction is important to the specific application being discussed, this essay uses FMEA as the general term.
Similarly, the Risk Priority Number, or RPN, appears frequently. The RPN is calculated by multiplying three ratings: severity, which measures how bad the consequences of a failure would be; occurrence, which measures how likely the failure is to happen; and detection, which measures how likely the failure is to be caught before it causes harm. Each rating is typically on a scale of 1 to 10, so the RPN ranges from 1 to 1,000. Higher RPNs indicate higher risk and therefore higher priority for corrective action. The RPN method has its critics, and Chapter 9 will discuss its limitations in detail. For now, it is enough to understand that the RPN is the primary tool that FMEA teams use to decide where to focus their attention.
Chapter Summary
FMEA was born in the U.S. military in the late 1940s as a reliability evaluation technique. It was formalized in MIL-P-1629 in 1949 and refined through aerospace applications, particularly the Apollo program. It spread to the automotive industry in the 1970s and 1980s, where it evolved into a broader quality and process improvement tool.
The maritime industry adopted FMEA in the 1980s, driven by the need to demonstrate redundancy in dynamic positioning systems. The Discoverer Seven Seas application in 1985 was the first documented maritime use. By the early 1990s, FMEA was embedded in DP vessel guidelines and IMO circulars, and classification societies made it a requirement for DP class notations. From there, FMEA spread to other ship systems and to the production process itself.
The chapters that follow will examine how FMEA is used in ship design, hull structure production, machinery and outfitting, and classification. They will present case studies from real shipyards, discuss the challenges and limitations of the method, and look at how FMEA is evolving through integration with data-driven techniques. The goal is a practical account of a practical tool, grounded in the realities of shipbuilding rather than the abstractions of risk theory.
Chapter 2: FMEA Fundamentals in a Shipbuilding Context
The Basic Logic
Every FMEA, regardless of industry, follows the same underlying logic. You take a system or a process, break it into manageable pieces, and then ask three questions about each piece. First, how could this piece fail? Second, what happens if it does fail? Third, how would we know it failed before the consequences become serious? The answers to those questions are then rated numerically, combined into a risk score, and used to decide where to spend money, time, and attention.
In an automotive plant, the "pieces" might be a brake caliper, a wiring harness, or a stamping press. In a shipyard, they are things like a hull block, a seawater cooling pump, a fuel oil transfer line, a bilge alarm sensor, or the sequence of operations used to erect a superstructure module onto a deck. The logic is identical. The vocabulary changes.
What makes shipbuilding different is the scale and the number of ways the same physical object can be examined. A single steel plate in a bulk carrier might be analyzed as part of a structural design FMEA (will it crack under fatigue loading?), as part of a process FMEA (will the welding procedure produce adequate penetration?), and as part of an operational FMEA (will the coating system prevent corrosion in the ballast tank?). Each analysis has a different team, a different scope, and a different set of failure modes. A shipyard that treats FMEA as a single document rather than a family of related analyses will miss most of the risk it is trying to manage.
Design FMEA and Process FMEA
The two broad categories of FMEA used in shipbuilding are design FMEA and process FMEA. The names are self-explanatory, but the boundary between them is not always clean.
Design FMEA examines the vessel or a system within it as it exists on paper, before or during detailed engineering. The question it asks is whether the design itself has weaknesses that could lead to failure. A design FMEA for a dual-fuel propulsion system might identify that the gas valve train has a single isolation valve shared between two redundant supply lines. If that valve fails closed, both lines lose gas, and the redundancy the designer intended is defeated by a common component. That is a design failure mode. It can be corrected on a drawing, at relatively low cost, long before anyone orders a valve.
Process FMEA examines the way the vessel is built. The question it asks is whether the manufacturing, assembly, or testing process could introduce defects or fail to catch them. A process FMEA for hull block erection might identify that the alignment of a block during fit-up depends on a single surveyor's measurement, with no independent check. If that measurement is wrong, the block is welded in the wrong position, and the error may not be discovered until the next block cannot be fitted. That is a process failure mode. It can be corrected by adding a verification step, training, or a temporary alignment jig.
The distinction matters because the corrective actions are different. Design failures are fixed by changing the design. Process failures are fixed by changing the procedure, the tooling, the inspection regime, or the training. A shipyard that confuses the two will spend money on the wrong solution. Adding an inspection step will not fix a design that has a common-cause failure built into it. Redesigning a component will not fix a welder who has not been trained on the correct technique.
Most large shipbuilding projects use both types of FMEA. Design FMEAs are typically performed during the basic and detailed design phases, often by the design office or by an external engineering consultancy. Process FMEAs are performed during production planning, often by the yard's quality or planning department, with input from foremen and skilled trades. The two analyses feed each other. A design FMEA may identify a component that is difficult to install, which then becomes a process failure mode in the production FMEA. A process FMEA may reveal that a design detail cannot be reliably welded, which then triggers a design change.
Severity, Occurrence, and Detection
The numerical heart of FMEA is the three rating scales: severity, occurrence, and detection.
Severity measures how bad the consequences of a failure would be if it occurred and was not caught. In shipbuilding, severity ratings are usually tied to safety, regulatory compliance, environmental impact, and cost. A severity of 10 is typically reserved for failures that could cause loss of life or the total loss of the vessel. A severity of 9 might be a failure that causes serious injury or a major structural failure. A severity of 7 or 8 might be a failure that renders the vessel unable to perform its mission, such as a propulsion loss that requires a tug escort back to port. Lower ratings cover failures that cause inconvenience, minor rework, or cosmetic defects.
The difficulty with severity in shipbuilding is that the same failure mode can have very different consequences depending on when it occurs. A crack in a hull weld discovered during block assembly is a rework problem. The same crack discovered during sea trials is a schedule problem. The same crack discovered in service, in heavy weather, is a safety problem. A well-constructed FMEA will define the operating context explicitly, so that the severity rating reflects the scenario being analyzed rather than a vague average of all possibilities.
Occurrence measures how likely the failure is to happen. This is where shipbuilding FMEA often runs into trouble. Unlike a car manufacturer that has produced hundreds of thousands of identical units and can calculate failure rates from warranty data, a shipyard may be building the first vessel of its kind. There is no historical data. The FMEA team must rely on expert judgment, on data from similar vessels if any exist, and on the experience of the tradespeople who will actually perform the work. Occurrence ratings in shipbuilding are therefore more subjective than in mass production, and the quality of the analysis depends heavily on who is in the room.
Detection measures how likely it is that the failure will be caught before it causes harm. This is partly a function of the inspection regime and partly a function of the failure mode itself. A missing weld is easy to detect visually. A lack of fusion inside a weld is not, unless ultrasonic or radiographic testing is performed. A mislabeled cable in a switchboard might not be detected until the system is energized and something fails. Detection ratings are usually assigned by asking what controls currently exist, how effective they are, and whether they are applied consistently.
The three ratings are multiplied together to produce the Risk Priority Number, or RPN. A failure mode with severity 8, occurrence 4, and detection 5 has an RPN of 160. A failure mode with severity 9, occurrence 2, and detection 8 has an RPN of 144. The second failure mode has a lower RPN, but it is arguably more dangerous, because the consequence is more severe and the failure is harder to detect. This is the central weakness of the RPN method, and it is a recurring theme in the literature on maritime FMEA. Chapter 9 will examine it in detail.
The FMEA Team
An FMEA is only as good as the people who perform it. A common failure in shipyards is to assign FMEA to a single engineer, who works alone in an office and produces a document that no one else reads. This defeats the purpose. FMEA is a team activity, and the team must include people who understand the system, people who understand the process, and people who understand the consequences.
A typical FMEA team for a shipbuilding project includes a facilitator, who knows the FMEA method and keeps the discussion on track; a design engineer, who understands the system being analyzed; a production engineer or foreman, who understands how it will actually be built; a quality or inspection representative, who understands the current controls; and, where safety-critical systems are involved, a representative from the safety or classification side. On large projects, the team may also include a representative from the equipment vendor, particularly for complex purchased systems such as thrusters or dynamic positioning computers.
The most valuable member of the team is often the person who has been doing the job for twenty years and has seen every possible way it can go wrong. That person's knowledge is not written down anywhere. It exists only in their head. An FMEA is one of the few formal processes in a shipyard that systematically extracts that knowledge and puts it where the rest of the organization can use it.
Timing and Scope
FMEA should be performed as early as possible in the relevant phase. A design FMEA performed after the design is frozen can still identify problems, but the cost of fixing them has already increased. A process FMEA performed after production has started can still improve the remaining work, but it cannot undo the defects already built into the vessel.
In practice, shipyards perform FMEA at several points. A preliminary design FMEA is often conducted during concept development, when the vessel's layout and major systems are still flexible. A detailed design FMEA follows during class approval and detailed engineering. Process FMEAs are conducted during production planning, before the relevant work packages are released to the shops. And on some projects, a review FMEA is conducted after sea trials to capture lessons for the next vessel.
The scope of each analysis must be defined clearly. An FMEA that tries to cover the entire vessel in one document will be too shallow to be useful. A better approach is to divide the vessel into systems or production zones, and to perform a focused FMEA on each one. A dynamic positioning FMEA, for example, covers the thrusters, the power generation and distribution system, the control computers, the sensors, and the operator interface. It does not cover the galley or the sewage treatment plant. A hull block process FMEA might cover only the welding and fit-up operations in one production shop. This kind of boundary-setting is essential. Without it, the analysis becomes unmanageable.
A Worked Example
To make the mechanics concrete, consider a simplified FMEA for a seawater cooling pump on a mid-sized cargo vessel. The pump supplies cooling water to the main engine and auxiliary machinery. The failure mode under consideration is loss of pump output due to impeller wear.
The effect on the system is reduced cooling capacity. If the vessel is operating in warm waters at high load, the engine may overheat. The severity is rated 7, because overheating can cause engine damage and a loss of propulsion. The occurrence is rated 4, based on the shipyard's experience with similar pumps and the expected operating profile. The detection is rated 3, because the pump is fitted with a flow sensor that alarms in the engine control room, and the crew performs daily checks. The RPN is 7 × 4 × 3 = 84.
A second failure mode on the same pump is seizure of the shaft due to bearing failure. The effect is immediate loss of cooling. Severity is rated 8, because the engine protection system will trip the engine, causing a loss of propulsion at sea. Occurrence is rated 2, because bearing failure is rare if maintenance is performed on schedule. Detection is rated 8, because there is no continuous bearing condition monitoring, and the failure may occur without warning between inspections. The RPN is 8 × 2 × 8 = 128.
The second failure mode has the higher RPN, and it would normally receive priority for corrective action. A reasonable response would be to install vibration monitoring on the pump bearings, which reduces the detection rating from 8 to 3 and lowers the RPN to 48. This is a simple example, but it illustrates how the method works and how it directs attention to the failure modes that most need it.
Chapter 3: FMEA in Ship Design and Engineering
The Point of Greatest Leverage
There is a principle in engineering that the cost of correcting a defect rises by an order of magnitude at each stage it survives. A flaw caught on a drawing costs a pencil stroke. The same flaw caught during fabrication costs a drawing revision, a production hold, and a meeting with the classification society. The same flaw caught during sea trials costs schedule, money, and reputation. The same flaw caught in service costs everything. FMEA, when applied during design, is the discipline of catching flaws while they are still pencil strokes.
The maritime industry learned this principle slowly. For much of the twentieth century, ship design followed a build, test, fix pattern. A vessel was designed, constructed, launched, and then subjected to sea trials. Problems discovered during trials were corrected, sometimes at enormous cost. The idea that a structured analysis could identify those problems before steel was cut was not widely accepted until dynamic positioning forced the issue.
This chapter examines how FMEA is used in ship design and engineering. It covers the systems that most commonly receive design-level FMEA treatment, the specific failure modes that designers look for, and the regulatory framework that makes FMEA mandatory for certain vessel types. It also draws on a specific case study from the literature to illustrate how design FMEAs work in practice.
Design FMEA Versus Process FMEA in the Shipyard
Before going further, it is worth restating the boundary between design FMEA and process FMEA, because in shipbuilding the boundary is often contested. Design FMEA examines the vessel as it exists in drawings and specifications. It asks whether the design itself has weaknesses that could lead to failure. Process FMEA examines the way the vessel is built. It asks whether the manufacturing process could introduce defects or fail to catch them.
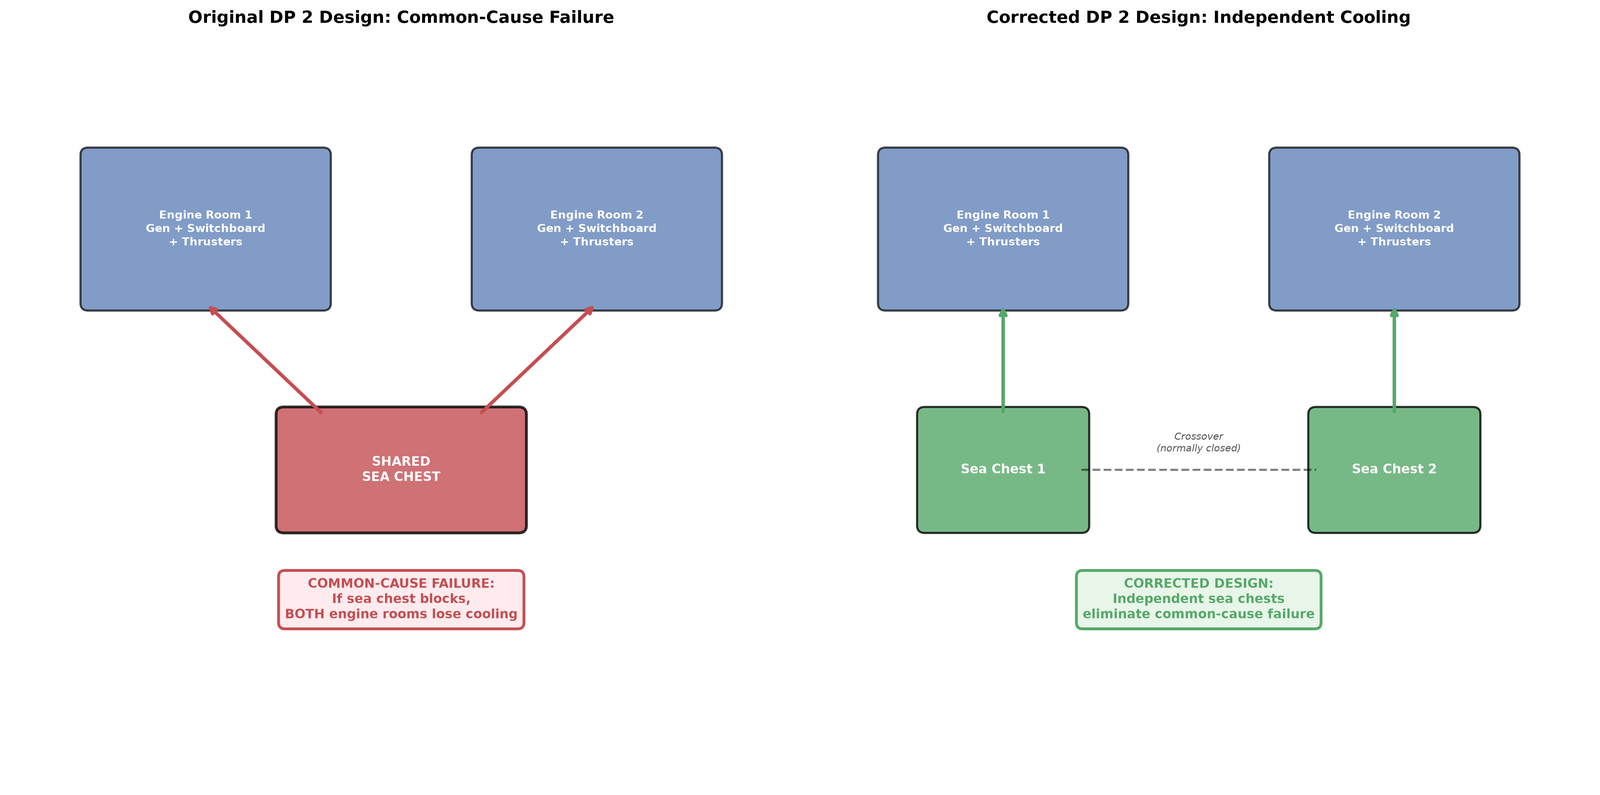
A design FMEA for a propulsion system might identify that the two redundant seawater cooling pumps share a common sea chest. If that sea chest becomes blocked by debris, both pumps lose suction, and the redundancy the designer intended is defeated by a shared component. This is a design failure mode. The corrective action is to provide independent sea chests or to install a crossover that allows either pump to draw from either chest. The fix happens on a drawing.
A process FMEA for the same system might identify that the sea chest strainer is installed during outfitting without a verification check on the mesh size. If the wrong mesh is installed, debris passes through and damages the pumps. This is a process failure mode. The corrective action is to add an inspection step, label the strainer, or introduce a parts verification procedure.
The distinction matters because the corrective actions are different, and the teams that perform the analyses are different. Design FMEAs are typically conducted by the design office, often with input from the class society and the equipment vendors. Process FMEAs are conducted by production engineering or quality control, with input from foremen and tradespeople. In practice, the two analyses feed each other. A design FMEA may identify a component that is difficult to install, which becomes a process failure mode. A process FMEA may reveal that a design detail cannot be reliably welded, which triggers a design change.
Dynamic Positioning: The Original Maritime FMEA Application
The maritime industry's first systematic use of FMEA was in dynamic positioning systems, and DP remains the most regulated and most mature application of the method in ship design. Dynamic positioning is the use of computer-controlled thrusters to maintain a vessel's position and heading without anchors. It is used on drillships, offshore supply vessels, cable layers, pipe layers, and a growing range of other vessel types.
The reliability requirements for DP are extreme. A drilling vessel that loses position may sever a wellhead, causing a blowout. An offshore supply vessel that drifts off station during a cargo transfer may collide with the platform it is servicing. A pipe layer that loses position may buckle its product. The consequences of failure are not measured in schedule delays. They are measured in environmental catastrophe and loss of life.
FMEA is the tool that the maritime industry uses to demonstrate that a DP system can tolerate failures without losing position. The method is straightforward in principle. The analyst breaks the DP system into its components, which include thrusters, generators, switchboards, control computers, sensors, and the cables and pipes that connect them. For each component, the analyst identifies the ways it could fail and traces the effects of that failure through the system. The question is always the same: if this component fails, can the vessel still maintain position and heading?
The answer depends on the vessel's DP class. The International Maritime Organization defines three equipment classes, and the classification societies implement them through their own notations. A DP 1 vessel is not required to be single-fault tolerant. A DP 2 vessel must be able to survive the failure of any single active component without losing position. A DP 3 vessel must be able to survive the failure of any single component, including a static component such as a cable or pipe, and must also survive a worst-case failure such as the flooding of one watertight compartment or the fire in one fire subdivision.
Classification societies require an FMEA for DP 2 and DP 3 vessels as a condition of class. The FMEA must demonstrate that the vessel's redundant systems are genuinely independent and that no single failure can defeat the redundancy. This is where design FMEA earns its keep. A DP system that looks redundant on a single-line diagram may contain a common-cause failure that defeats the redundancy in practice.
Consider a common example. A DP 2 vessel has two independent engine rooms, each with its own generators, switchboard, and thruster group. The design appears fully redundant. But both engine rooms share a common seawater cooling system that draws from a single sea chest. If that sea chest is blocked, both engine rooms lose cooling, both generator groups shut down, and the vessel loses position. The FMEA identifies this common-cause failure, and the design is changed to provide independent cooling systems or a crossover arrangement that allows either engine room to survive the loss of the shared sea chest.
This is the kind of failure mode that a design FMEA is designed to catch. It is invisible on a system diagram that shows only the power and control architecture. It becomes visible when the analyst traces the cooling water through the system and asks what happens if the seawater supply is lost.
The regulatory framework for DP FMEA is well established. The IMO issued MSC/Circ.645 in 1994, which established FMEA as the primary means of demonstrating DP redundancy. This was superseded by MSC.1/Circ.1580 in 2017, which provides more detailed guidance on the scope and content of DP FMEAs. The classification societies, including ABS, DNV, and Lloyd's Register, implement these guidelines through their own rules and notations. The American Bureau of Shipping, for example, specifies that a DP 2 vessel must survive the failure of any active component, including generators, thrusters, switchboards, communication networks, DP control computers, and sensors. A DP 3 vessel must additionally survive the failure of any normally static component, including cables, pipes, and manual valves, and must survive the flooding of any one watertight compartment or the fire in any one fire subdivision.
The FMEA for a DP system is not a one-time document. It is a living analysis that must be updated when the vessel's configuration changes and must be verified through annual DP trials. The trials test the failure modes identified in the FMEA by simulating failures and observing the system's response. If the system does not respond as predicted, the FMEA must be revised, and the design or the operating procedures must be changed.
Design FMEA for Propulsion and Power Systems
Beyond dynamic positioning, design FMEA is applied to the vessel's propulsion and electrical power systems. These systems are the vessel's heart and lungs. If they fail, the vessel is dead in the water, and the consequences can range from inconvenience to catastrophe depending on where the vessel is and what it is doing.
A design FMEA for a propulsion system typically begins with a functional breakdown. The propulsion system must convert fuel into thrust. It must do so reliably under a range of operating conditions. It must be controllable from the bridge. It must shut down safely in an emergency. The analyst then asks how each of these functions could fail.
For a conventional diesel-mechanical propulsion system, the failure modes include fuel starvation, loss of cooling, loss of lubrication, overspeed, and shaft failure. Each of these failure modes has causes and effects that can be traced through the system. Fuel starvation, for example, can be caused by a blocked filter, a failed transfer pump, a contaminated fuel supply, or a closed valve. The effect is a loss of power, which may be gradual or sudden depending on the cause. If the vessel is in a narrow channel or approaching a berth, a sudden loss of power is a serious event.
The FMEA process forces the design team to consider these scenarios systematically. For each failure mode, the team assigns severity, occurrence, and detection ratings and calculates an RPN. Failure modes with high RPNs receive priority for design changes or additional controls. A high severity rating for fuel starvation might lead the team to specify dual fuel filters with automatic changeover, or a fuel conditioning system that monitors quality continuously. A high occurrence rating for a particular failure mode might lead to a design change that eliminates the failure mode entirely.
The design FMEA for electrical power systems follows a similar logic. The vessel's electrical system must generate, distribute, and deliver power to the propulsion system, the auxiliary machinery, and the hotel loads. Failure modes include generator failure, switchboard failure, cable failure, and protection system failure. The consequences depend on the vessel's configuration. A vessel with a single main switchboard may lose all power if the switchboard fails. A vessel with split switchboards and a bus tie may be able to isolate the fault and continue operating on the unaffected side. The FMEA identifies which configuration provides the required level of redundancy and which failure modes could defeat it.
A Case Study: Design FMEA in Practice
The published literature on design FMEA in shipbuilding is less extensive than the literature on process FMEA, but there are useful case studies. One study examined the application of design FMEA to the quality control of ship design, combining the FMEA method with fishbone diagrams to identify the root causes of design errors. The study found that many design defects originated not in the technical calculations but in the communication and documentation processes that supported the design work. A drawing that was correct in isolation became a defect when it was issued without the correct revision number, or when a change was made on one drawing but not on the interfacing drawing. The FMEA identified these process failures and led to the introduction of design process cards that tracked the status of each drawing and ensured that changes were communicated to all affected parties.
Another study, focused on marine engineering more broadly, reviewed the application of FMEA and FMECA to ship power systems and concluded that the method has been widely applied to the failure and risk assessment of these systems. The review noted that FMEA is increasingly being integrated into the full life cycle of ships, from design and operation to maintenance, forming a closed-loop risk management system. This is a significant evolution. Traditional FMEA was a one-time analysis performed during design. The emerging approach is a continuous process that uses operational data to update the design FMEA and to inform future design decisions.
New Fuels, New Failure Modes
The transition to alternative fuels is creating new design challenges that FMEA is uniquely suited to address. Hydrogen fuel cells, methanol engines, ammonia engines, and battery-electric propulsion systems all introduce failure modes that did not exist in conventional diesel vessels.
A study of a hydrogen fuel cell powered vessel used FMEA to analyze the storage and supply system for hydrogen, identifying potential risk factors and proposing measures to reduce or eliminate them. Hydrogen is a challenging fuel. It is stored at high pressure or at cryogenic temperatures. It has a wide flammability range and a low ignition energy. A leak that would be harmless with diesel fuel could be catastrophic with hydrogen. The FMEA for a hydrogen system must consider failure modes such as seal leakage, pressure relief valve failure, hydrogen embrittlement of metal components, and inadequate ventilation in the fuel storage space. Each of these failure modes has a severity rating that reflects the unique hazards of hydrogen.
The classification societies have developed guidelines for FMEA of hydrogen-fueled vessels. The China Classification Society, for example, specifies that FMEA should be applied to important equipment and systems such as fuel cells, hydrogen fuel engines, and electrical systems. Similar guidance exists for methanol and ammonia fueled vessels. The common thread is that novel fuels introduce novel failure modes, and FMEA provides a structured way to identify them before the vessel is built.
Human Factors in Design FMEA
One of the persistent challenges in design FMEA is the treatment of human error. A vessel is designed to be operated by people, and those people will make mistakes. A well-designed vessel is one that tolerates human error without catastrophic consequences. A poorly designed vessel is one that turns a simple mistake into a disaster.
Design FMEA can address human error in two ways. The first is to identify failure modes that are caused by human error and to assess their severity, occurrence, and detection. If a valve is installed in a location that is difficult to reach, the occurrence of a maintenance error is higher than if the valve is easily accessible. The FMEA can recommend a design change that improves access, reducing the occurrence rating and the RPN.
The second approach is to treat the human operator as a component in the system and to analyze the ways in which the operator can fail. The operator can fail to detect an alarm, fail to respond correctly to a warning, or fail to perform a maintenance task correctly. These human failure modes are more difficult to analyze than hardware failure modes because human behavior is more variable. But ignoring them produces an incomplete analysis. A DP system that is fully redundant in hardware but depends on a single operator to detect a failure and initiate a response is not truly redundant.
The literature on maritime FMEA acknowledges this gap. A review of FMEA in marine engineering noted that human factors are often underrepresented in FMEA applications, even for systems where human error is a significant contributor to risk. The integration of human reliability analysis methods with FMEA is an area of ongoing research.
The Design FMEA Team and Its Challenges
A design FMEA for a ship system is not a solo activity. It requires a team that includes the design engineer who understands the system, a production representative who understands how the system will be built, a safety or class representative who understands the regulatory requirements, and, for complex purchased systems, a vendor representative who understands the equipment.
The most common failure of design FMEA in shipbuilding is not technical. It is organizational. A design office that treats FMEA as a documentation requirement rather than a design tool will produce an FMEA that satisfies the class society but does not improve the vessel. The difference between a useful FMEA and a useless one is almost always the quality of the team and the willingness of the participants to challenge assumptions.
A useful design FMEA will identify failure modes that no single member of the team would have identified alone. The design engineer knows the system architecture but may not know that a particular valve is difficult to access. The production foreman knows that the valve is difficult to access but may not know that its failure has safety implications. The class surveyor knows the regulatory requirements but may not know that the system has a hidden common-cause failure. The FMEA brings these perspectives together and forces them to confront the same set of questions.
Chapter Summary
Design FMEA is the highest-leverage application of the method in shipbuilding. It catches failure modes while they are still on paper, when the cost of correction is lowest. The maritime industry's first systematic use of FMEA was in dynamic positioning systems, driven by the need to demonstrate redundancy for DP 2 and DP 3 class notations. The IMO and the classification societies now require FMEA for these vessels, and the method has spread to propulsion, electrical power, and other critical systems.
The published case studies show that design FMEA works best when it is integrated with other design quality tools, such as fishbone diagrams and design process tracking. The transition to alternative fuels is creating new failure modes that FMEA is well suited to identify. The treatment of human error remains a gap, but the integration of human reliability methods with FMEA is an active area of research. The most important factor in the success of a design FMEA is the quality of the team that performs it. A team that includes design, production, and regulatory perspectives will identify failure modes that no single discipline would find alone.
Chapter 4: FMEA in Hull Structure Production
Where Risk Lives in the Shipyard
The design office is quiet. The hull production shop is not. It is noise, sparks, overhead cranes, and steel moving through stations in a sequence that has been planned down to the hour. Plates arrive, are cut, cleaned, fitted, welded, ground, bent, and assembled into blocks that weigh hundreds of tonnes. Each of those operations carries risk, not only to the vessel's quality but to the people performing the work.
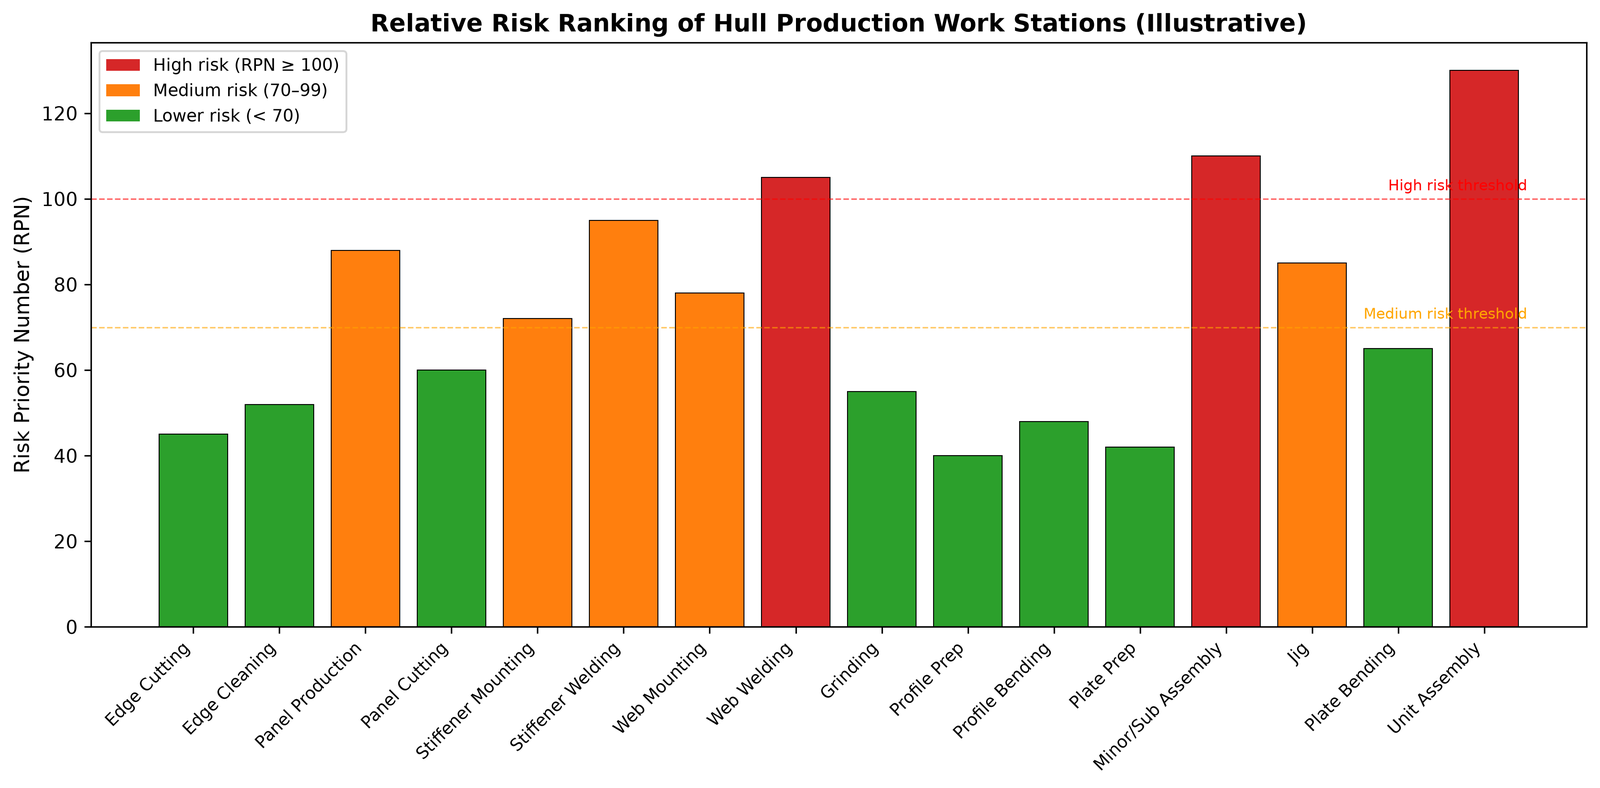
A shipyard in Türkiye's Tuzla region, which became the subject of one of the most detailed published FMEA studies in shipbuilding, recorded 181 failures between 2009 and 2011. These were not design flaws discovered on paper. They were events on the shop floor: injuries, near-misses, equipment failures, and work stoppages. The yard consumed 20,000 tonnes of steel per year, and its production system was organized around a series of work stations that moved material from raw plate to completed hull blocks. The study that analyzed these failures used FMEA to identify which stations and which activities carried the highest risk, and its findings offer a practical template for how the method can be applied to hull structure work.
Mapping the Hull Production Process
Before any FMEA can be performed, the process itself must be understood. Hull structure production in a modern shipyard is a flow of material and work through a series of stations, each with a specific function. The Özkök study, published in the Journal of Marine Science and Technology, documented the station layout of the Tuzla yard in detail. The process begins at the edge-cutting station, where hull plates are cut to size. The plates then move to edge cleaning and sequencing, where slag and burrs are removed and the plates are arranged in the order they will be used. From there they go to panel production, where plates are welded into flat panels. Panel cutting follows, trimming the welded assembly to its final dimensions. Profiles are then mounted and welded onto the panels at the stiffener mounting and stiffener welding stations. Minor and subassemblies are joined at the web mounting and web welding stations, and the completed panels are ground and prepared for the next stage.
A parallel line handles profiles and smaller components. The profile piece part preparation station cuts standard profiles to length using plasma cutting. The profile bending station shapes them on a frame bender. The plate piece part preparation station, which the study describes as "the heart of the shipyard production system," performs nest-cutting of plates to produce single plate piece parts. Minor and subassemblies are fabricated at their own station, and curved panel assemblies are produced on adjustable pin jigs. Plate bending transforms flat plates into curved ones, and the unit assembly station brings together the structures and parts from the previous stations to form the block.
The material flow between these stations is not random. It follows a defined sequence, and any delay or defect at one station propagates downstream. A misaligned plate at the panel production station becomes a fitting problem at the stiffener mounting station. A weld defect at the stiffener welding station becomes a rework job at the grinding station. This interconnectedness is what makes FMEA so useful in this context. It is not enough to ask "what can go wrong at this station?" The more important question is "what happens to the rest of the production line if this goes wrong?"
The Özkök Study: Calculating Risk with Duration
The Tuzla study made a methodological adjustment that is worth examining closely, because it addresses a limitation of traditional FMEA in a production environment. Standard FMEA calculates the Risk Priority Number as severity times occurrence times detection. The study replaced detection with duration. The reasoning was straightforward. In a production process, the length of time a worker is exposed to a risk is a direct contributor to the likelihood that the risk will materialize. Two welders performing the same task, one for two hours and one for four hours, do not face the same risk. The second welder is exposed twice as long and therefore faces a higher cumulative risk.
This modification is not cosmetic. It changes the priorities that emerge from the analysis. A task with a high severity and a moderate occurrence but a short duration might rank lower than a task with the same severity and occurrence but a much longer duration. In a shipyard, where some operations take minutes and others take days, this distinction matters. The study calculated RPNs as severity times occurrence times duration, and then used those RPNs to rank the work stations and activities.
The study's broader finding was that the most risky activities in hull structure production were concentrated in a handful of stations, and that those stations shared common characteristics: heavy material handling, confined spaces, hot work, and long exposure times. The failures documented in the yard's records fell into eight categories, and the FMEA allowed the researchers to trace those categories back to the conditions that produced them.
Welding: The Most Common Operation and the Most Common Source of Risk
Welding is the defining operation of hull structure production. A mid-sized vessel contains kilometres of weld, and every metre is a potential failure point. A separate FMEA study, conducted for the Turkish Ministry of Labour and Social Security, focused exclusively on the welding process in shipyards and identified thirty distinct failure modes. The study grouped these into three functional categories: machine function, human function, and environment function. Sixteen failure modes were related to the welding machine itself, nine to the human operator, and five to the working environment.
The three highest-ranked failure modes, based on RPN, were deformation of the electric cable connected to the welding machine, excessive air flow during welding operations, and untidy cable placement in the work environment. All thirty failure modes had RPN values above 40, which the study noted as a threshold for concern. What is striking about these results is that the top three failures are not welding defects in the conventional sense. They are not cracks, porosity, or incomplete penetration. They are conditions that degrade the welding process before the arc is even struck. A deformed cable can cause voltage drop, which affects heat input and penetration. Excessive air flow, from a ventilation system or an open shop door, can blow shielding gas away from the weld pool, causing porosity. Untidy cables are a tripping hazard and can be damaged by moving equipment, leading to the same voltage problems as a deformed cable.
This finding has a practical implication for shipyards. The most effective way to improve weld quality may not be to retrain welders or to increase inspection. It may be to manage the conditions in which welding takes place. A cable management system, a controlled ventilation regime, and a housekeeping standard can eliminate the failure modes that rank highest in the FMEA. The study's authors noted that predetermining these failures has vital importance for maintaining worker health and safety, and that the FMEA method provided a structured way to rank them by danger priority.
A separate study from PT. PAL Indonesia, examining welding quality control on a shipbuilding project, identified incomplete penetration as the most dominant defect, accounting for 32.81 percent of all welding defects. The FMEA analysis traced the root cause to an excessively narrow root gap, and the RPN for that failure mode was calculated at 288. Crack defects also scored an RPN of 288, with the potential error being poor material conditions during welding. Porosity followed at 280, spatter at 196, and undercut at 175. The corrective actions recommended by the study included checks on material surface condition, welding gap, gas use, understanding of the welding procedure specification, and welder skill before each welding operation.
Block Erection and Assembly: The High-Risk Frontier
If welding is the most common operation, block erection is among the most hazardous. Moving a 200-tonne steel block through the air with an overhead crane, lowering it into position on another block, and fitting the two together to within millimetres is a task that concentrates risk in a short window of time. A failure during erection can injure or kill the workers below, damage the block, and delay the entire construction schedule.
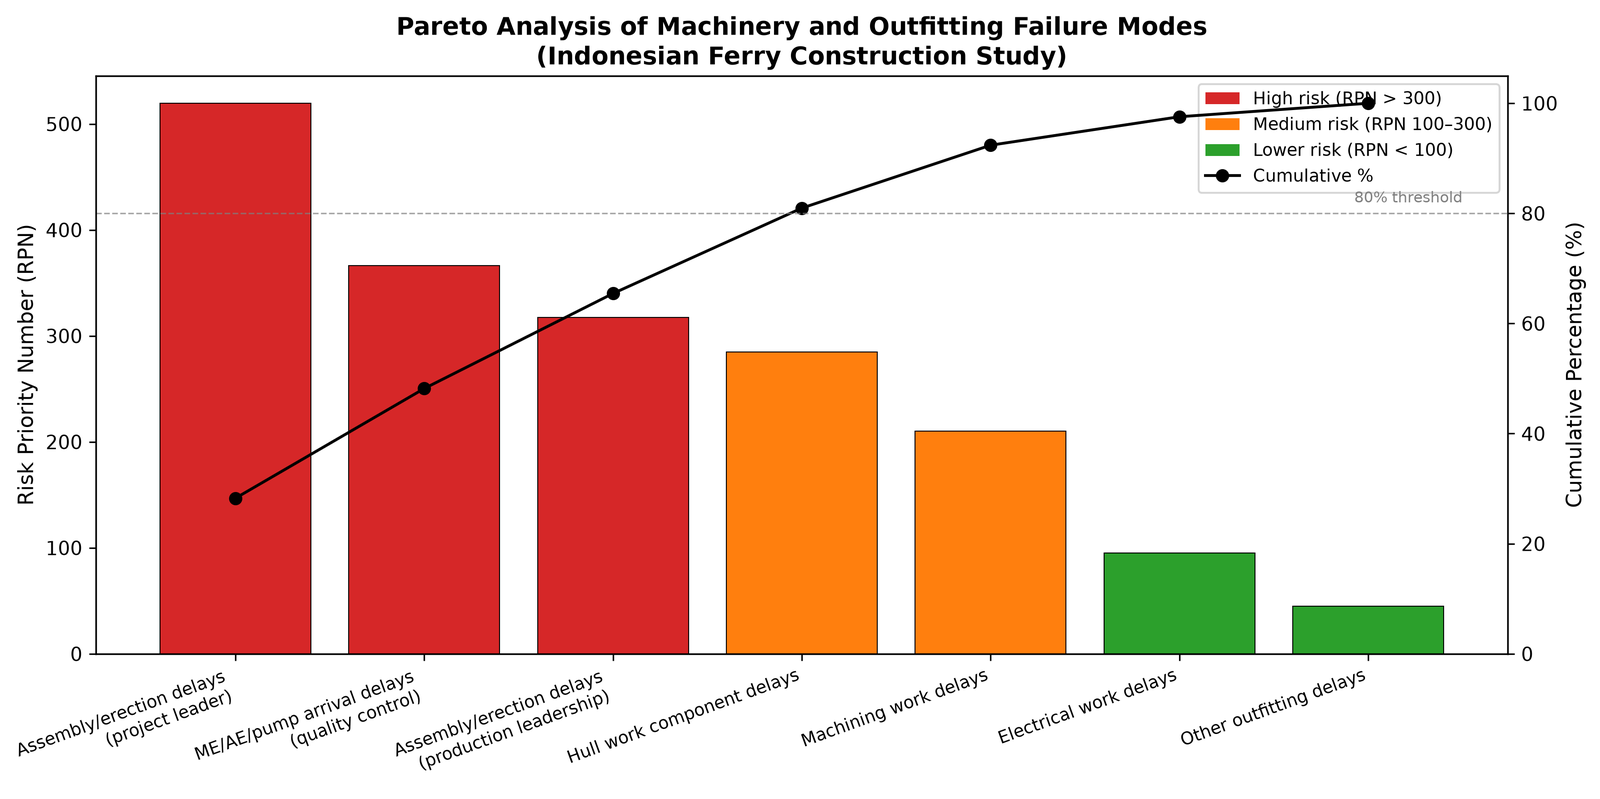
The Indonesian ferry construction study mentioned in Chapter 1 examined the risks associated with hull work in a 600 DWT Ro-Ro ferry built in an Indonesian shipyard. The study identified 23 potential hazard sources and calculated RPNs for each. The highest RPN in the entire study, 519.49, was associated with delays in the assembly, fabrication, and erection processes, assessed from the perspective of the project leader. Delays in the arrival of main engines, auxiliary engines, pumps, and other mechanical equipment scored 366.18 from the quality control perspective, and production leadership assessed assembly and erection delays at 317.37.
The study's risk matrix classified component delays in ship hull work as high risk, machining work as medium risk, and electrical work as low risk. The dominance of hull work in the risk profile is consistent with the Özkök study's findings and with the practical reality of ship construction. The hull is built first, and it is built under the greatest time pressure. Delays in hull work cascade into every subsequent stage of outfitting and commissioning.
A separate study of an LPD 124 M vessel at PT. PAL Indonesia reported that fitting operations in the sub-assembly and assembly shop carried a misalignment risk with an RPN of 161, while welding in the same shop carried a crack risk with an RPN of 175. These values are lower than the ferry study's delay-related RPNs, which suggests that the two studies were measuring different categories of risk. The ferry study focused on schedule risk, while the LPD study focused on quality and safety risk. Both are valid applications of FMEA, but they produce different priority rankings. A shipyard that cares most about schedule performance will focus on the failure modes that cause delays. A shipyard that cares most about structural integrity will focus on the failure modes that cause defects. The FMEA can serve either purpose, but the scope must be defined clearly at the outset.
What the Hull Production FMEAs Reveal
Across the published studies, several patterns emerge that are consistent enough to be considered general findings about risk in hull structure production.
First, the highest-risk activities are not the most technically complex ones. They are the ones where heavy material, hot work, and human exposure converge. Lifting and moving blocks, welding in confined spaces, and working at height on scaffolding all score high because the consequences of failure are severe and the exposure is prolonged. The Özkök study noted that the greatest risks in ship production are "conventional risks" connected to machine equipment, scaffolding, electricity use, and the lifting of pieces and assembling groups.
Second, process failures and product failures are intertwined. A welding defect is a product failure, but its root cause is often a process failure: a cable that was not maintained, a ventilation system that was not adjusted, a welder who did not understand the procedure specification. The FMEA is most useful when it traces defects back to their process origins rather than treating them as isolated quality problems.
Third, schedule risk and quality risk are not the same thing, and a shipyard that conflates them will misallocate its resources. The ferry study's finding that assembly and erection delays carry the highest RPN does not mean that assembly and erection are the most dangerous activities. It means they are the most schedule-critical. A yard that responds to this finding by adding inspection staff to the assembly shop may not address the actual cause of the delays, which could be upstream material shortages, crane availability, or design changes.
Applying FMEA to a Hull Block: A Worked Illustration
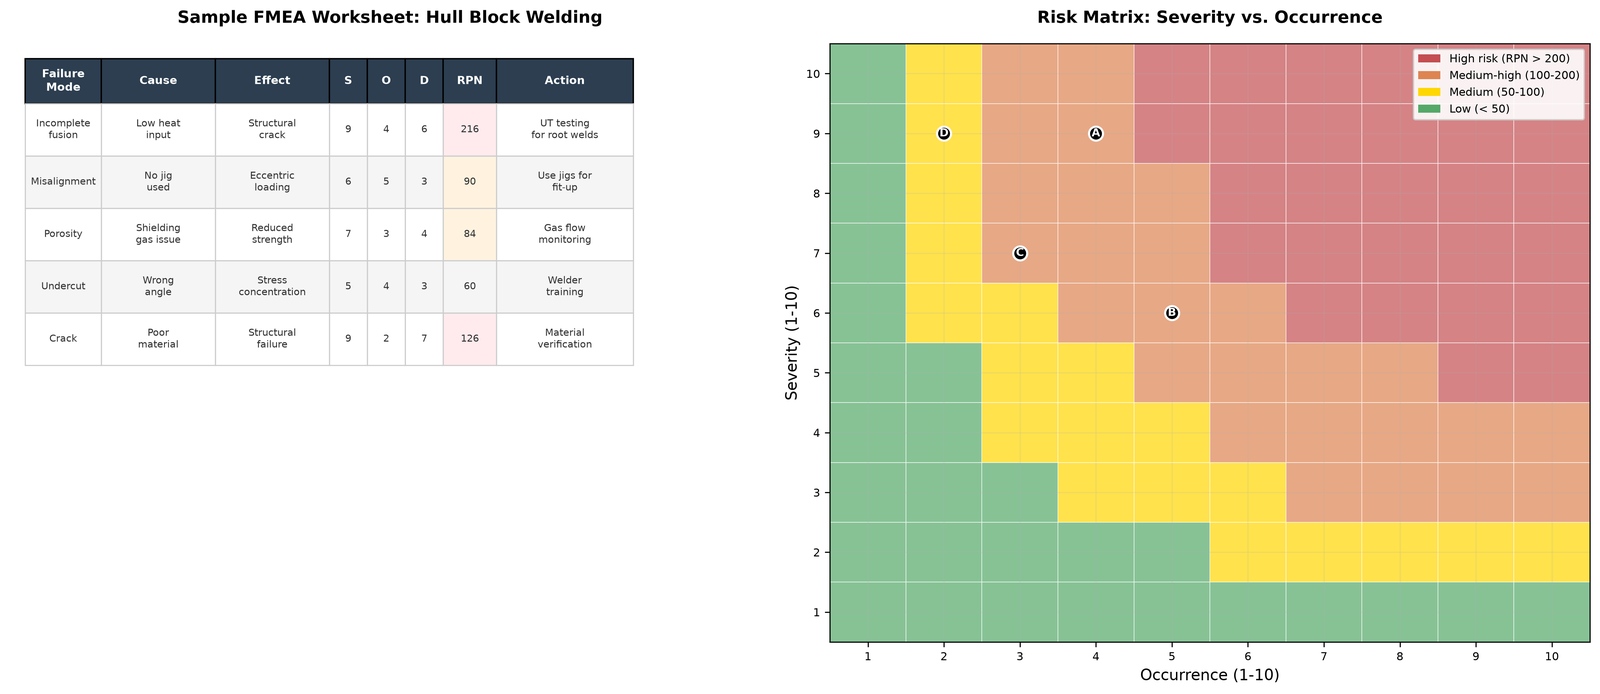
To make the method concrete, consider a simplified process FMEA for the welding of a hull block stiffener. The operation involves fitting a profile onto a flat panel and welding it in place. The failure mode under consideration is incomplete fusion at the weld root.
The effect is a weld that does not achieve full penetration. Under cyclic loading in service, the weld may crack and propagate, potentially leading to structural failure. Severity is rated 9, because a structural failure in the hull can compromise watertight integrity and endanger the vessel. Occurrence is rated 4, based on the yard's historical defect rates for this type of weld. Detection is rated 6, because the weld is visually inspected but not routinely tested with ultrasonic methods. The RPN is 9 × 4 × 6 = 216.
A second failure mode for the same operation is misalignment of the stiffener during fit-up. The effect is a weld that is offset from the intended position, creating an eccentric load path and reducing the stiffener's effectiveness. Severity is rated 6, because the structural consequence is less immediate than incomplete fusion but still significant. Occurrence is rated 5, because fit-up errors are common when jigs are not used. Detection is rated 3, because misalignment is visually obvious and is usually caught before welding begins. The RPN is 6 × 5 × 3 = 90.
The first failure mode has the higher RPN and would receive priority. A reasonable corrective action would be to introduce ultrasonic testing for a percentage of root welds, which reduces the detection rating from 6 to 2 and lowers the RPN to 72. Alternatively, the yard could invest in welder training focused specifically on root pass technique, which reduces occurrence from 4 to 2 and lowers the RPN to 108. The FMEA does not dictate which action to take. It provides the structure for making the decision.
Chapter Summary
Hull structure production is where FMEA meets the shipyard floor. The Özkök study of a Turkish shipyard demonstrated how the method can be applied across a sequence of work stations, with a modified RPN calculation that incorporates duration of exposure. The welding FMEA study identified thirty failure modes and found that the highest-risk conditions were environmental and equipment-related rather than defects in the finished weld. The Indonesian ferry study showed that schedule-related failure modes in hull work carry the highest RPNs when the analysis is scoped to project delivery.
The common thread across these studies is that hull production risk is concentrated in a few stations and a few activities, and that those risks are largely predictable. Heavy lifting, confined space welding, and prolonged exposure to hot work and moving equipment are the recurring themes. FMEA provides a structured way to identify these risks, quantify them, and direct corrective action where it will have the greatest effect.
Chapter 5: FMEA for Machinery, Piping, and Outfitting
The Space Between the Hull and the Hotel
Once the hull is closed and the blocks are joined, the vessel enters a phase that shipyard workers sometimes describe as the "fiddly part." Machinery arrives from vendors and must be lowered into the engine room through openings that were planned two years earlier. Piping systems run through every compartment, from the double bottom to the funnel, carrying seawater, fuel, lubricating oil, hydraulic fluid, compressed air, and sewage. Electrical cables snake through cable trays and penetrate watertight bulkheads at certified locations. Outfitting crews install floors, ceilings, insulation, doors, ladders, railings, and the hundreds of small components that turn a steel structure into a working vessel.
This phase concentrates a different kind of risk than hull production. The failure modes are less about structural collapse and more about system unreliability, installation error, and schedule delay. A misplaced pipe support can vibrate loose in service and cause a leak. A cable installed in the wrong tray can be damaged by heat from a nearby exhaust line. A pump delivered late can hold up an entire compartment's outfitting sequence, cascading delays through commissioning and sea trials.
FMEA is well suited to this phase, but it is applied differently than in hull production. The scope is broader, the systems are more interconnected, and the boundary between design failure modes and process failure modes is often blurred. This chapter examines how FMEA is used for machinery systems, piping, and outfitting, drawing on published case studies from shipyards in Indonesia, Brazil, Finland, and elsewhere.
Machinery Systems: Engines, Pumps, and the Equipment That Keeps a Ship Alive
The engine room is the most densely packed space on a vessel. A mid-sized cargo ship might have a main engine, three or four auxiliary generators, fuel oil separators, lubricating oil purifiers, seawater cooling pumps, freshwater cooling pumps, ballast pumps, fire pumps, bilge pumps, air compressors, hydraulic power units, and a fuel conditioning system, all within a space the size of a large living room. Every one of these components can fail, and the consequences of failure range from inconvenience to catastrophe.
A 2024 study published through the American Society of Mechanical Engineers examined the main engine system of an anchor handling tug supply vessel operating off West Africa. The study used FMEA to assess the risks of component failures and found that machinery and engine failure has been cited as the foremost cause of shipping incidents. The researchers collected data from vessel owners and used questionnaires with experienced subject matter experts to identify the most critical components of the main engine system. The finding that the main engine is the most important system on this vessel type is not surprising, but the FMEA process allowed the researchers to rank the individual components within the engine system by their risk contribution. The results were used to inform maintenance planning and to prioritize spare parts procurement.
A separate study focused on a different but equally critical machinery system: the lubricating oil system. This study, published in Ocean Engineering, introduced a fuzzy parameterized fuzzy soft matrices-based FMEA method to improve risk assessment accuracy for ship lubrication systems. The researchers noted that traditional FMEA often fails in complex systems because it does not capture uncertainties in expert opinions and dynamic operational conditions. Their method prioritized sensor-based failures, with temperature sensor failure ranking as the highest risk. This finding is significant because it suggests that in modern automated engine rooms, the sensors that monitor the machinery may be more critical than the machinery itself. A lubricating oil valve that fails is a problem. A temperature sensor that fails silently is a worse problem, because it may prevent the control system from detecting a real fault.
The cruise ship industry has also been the subject of machinery FMEA research. A 2025 study in Applied Soft Computing examined the turbocharger and lubrication system risks on a cruise ship, using the Carnival Freedom incident near the Cayman Islands in October 2019 as a case study. The incident involved a turbocharger failure that caused significant operational disruption. The researchers integrated type-2 fuzzy-FMECA with a dynamic Bayesian network to conduct a quantitative risk assessment. They found that low-pressure switch and pressure control valve malfunctions were the leading causes of failure. The study demonstrated a strong positive correlation of 0.99 between the traditional RPN method and their proposed fuzzy logic approach, which validates the traditional method while showing that fuzzy methods can handle expert uncertainty more effectively.
Piping Systems: The Vessel's Circulatory System
Piping is the circulatory system of a ship. It carries fluids that are essential for propulsion, safety, and crew survival. A failure in a fuel oil line can cause a fire. A failure in a seawater cooling line can cause an engine to overheat. A failure in a fire main can render the vessel's firefighting system useless at the moment it is needed most.
A study presented at the 24th ABCM International Congress of Mechanical Engineering applied process FMEA to the pipe manufacturing process in a shipyard in Pernambuco, Brazil. The study aimed to identify the main failures in pipe manufacturing, determine the process stage that accumulated the highest failure rate, and measure the impacts of those failures on productivity. The researchers found that the PFMEA technique facilitated understanding of each potential failure mode and gave direction to managerial and operational efforts to minimize or eliminate risk. The study is notable for its focus on the manufacturing process rather than the design of the piping system. In shipyards, piping is often fabricated on site, cut and welded to fit the spaces where it will be installed. The quality of that fabrication work is a major determinant of system reliability.
A different application of piping FMEA comes from the Finnish maritime industry. A master's thesis at Aalto University examined leakage risks in a propulsion system's piping and fittings. The researcher used FMEA to assess the severity, occurrence, and detection of leakage failure modes and found that the highest RPN values were associated with rigid tubing and stud-end fittings in machined parts. The study then used the FMEA results to drive a design change. The original design had fifteen components and three different tightening procedures. The proposed design reduced the component count to eight, used only two tightening procedures, and replaced a problematic rigid tube with a flexible hose. The FMEA did not just identify the problem. It provided the data needed to justify the redesign and to measure the improvement.
Another study, focused on pipe materials management in a shipyard, used FMEA alongside the New Seven Tools quality analysis method to investigate why large amounts of pipe material were being left over after production. The analysis identified the lack of ability and accuracy of workers in the management and maintenance of materials and machines as the primary cause. The recommended improvements included training and socialization of standard operating procedures for machine operation, routine maintenance, and improved material storage. This application of FMEA is somewhat unusual because it focuses on material waste rather than safety or reliability. But it illustrates the flexibility of the method. Any process that produces undesirable outcomes can be analyzed with FMEA.
Outfitting: Where Quality and Safety Meet
Outfitting is the phase where the vessel becomes habitable and operable. It includes the installation of accommodation spaces, galleys, sanitary systems, ventilation, air conditioning, electrical distribution, navigation equipment, and deck machinery. Outfitting failures are often less dramatic than hull or machinery failures. A leaking shower drain does not sink a ship. A malfunctioning air conditioning unit does not stop the engine. But outfitting failures affect crew comfort, morale, and operational efficiency, and in some cases they have safety implications. A faulty ventilation system in a paint store can create an explosive atmosphere. A poorly installed electrical panel can overheat and cause a fire.
A study from the Korean shipbuilding literature examined the quality assessment of hatchway components on a bulk carrier using both Quality Function Deployment and FMEA. The researchers divided quality into two dimensions: performance, which they analyzed with QFD, and safety, which they analyzed with FMEA. They identified eight important components from a performance perspective and twelve from a safety perspective, with seven components appearing on both lists. These seven components were identified as the ones that designers should prioritize for improvement. The study's approach is instructive because it shows how FMEA can be integrated with other quality methods to produce a more complete picture of what matters. Performance analysis tells you what the customer wants. Safety analysis tells you what could go wrong. The overlap between the two is where the highest-priority improvements lie.
Another Korean study, published in the Journal of the Society of Naval Architects of Korea, applied QFD and FMEA to the hatchway of a bulk carrier. The researchers found that the QFD and FMEA methods produced complementary results. QFD identified the components that contributed most to customer satisfaction, while FMEA identified the components that contributed most to risk. The components that appeared on both lists were the ones that deserved the most attention from designers.
A recent study from Indonesia examined the application of FMEA to outfitting work on an LPD 124 M vessel at PT. PAL Indonesia. The study focused on the machinery outfitting and electrical outfitting departments, including the piping workshop, machinery outfitting workshop, and electrical workshop. The FMEA analysis identified risks at the component level and calculated RPNs for each. The study's findings were used to develop a model for improving the outfitting process and reducing the risk of delays and defects. This application of FMEA is notable because it treats outfitting as a production process rather than a design activity. The failure modes are not "the valve fails in service" but "the valve is installed incorrectly" or "the valve arrives late." The corrective actions are process changes, not design changes.
The Ferry Construction Case Study: A Closer Look
The most detailed published FMEA study of machinery and outfitting in shipbuilding is the Indonesian ferry construction study introduced in earlier chapters. The study, published in the Journal of Applied Engineering Science, examined the construction of a 600 DWT Ro-Ro ferry in an Indonesian shipyard. The researchers identified 23 potential hazard sources and calculated RPNs for each. The results revealed a clear hierarchy of risk.
The highest RPN in the study, 519.49, was associated with delays in the assembly, fabrication, and erection processes, assessed from the perspective of the project leader. This is a schedule risk rather than a safety risk. The project leader was concerned that delays in the hull work would cascade into the outfitting and commissioning phases and ultimately delay delivery of the vessel. The second-highest RPN, 366.18, was associated with delays in the arrival of main engines, auxiliary engines, pumps, and other mechanical equipment, assessed from the quality control perspective. The third-highest, 317.37, was assessed by production leadership and also related to assembly and erection delays.
The study's risk matrix classified component delays in ship hull work as high risk, machining work as medium risk, and electrical work as low risk. This ranking is consistent with the practical reality of ship construction. The hull is built first and is the most schedule-critical. Machinery installation depends on the hull being ready. Electrical work comes later and has more float in the schedule.
What makes this study valuable is its explicit recognition that different stakeholders perceive risk differently. The project leader was most concerned about schedule delays because the project leader's performance is measured by on-time delivery. The quality control section was most concerned about equipment arrival delays because those delays affect the quality of the installation work. Production leadership was concerned about assembly delays because those delays affect the productivity of the workforce. The FMEA captured all three perspectives, and the comparison among them revealed where the priorities of different departments diverged.
The study also noted that the risk assessment was based on field observations and interviews rather than historical failure data. This is a common limitation in shipyard FMEA. A yard that is building a vessel type for the first time may not have data on failure rates for that vessel type. The FMEA team must rely on expert judgment, which introduces subjectivity. The study acknowledged this limitation and recommended that future research assess the potential of domestic components and design a component availability model for new shipbuilding.
A Worked Example: FMEA for a Seawater Cooling Pump Installation
To make the machinery and piping FMEA process concrete, consider a simplified process FMEA for the installation of a seawater cooling pump in an engine room. The pump is a critical component. If it fails, the main engine and auxiliary generators lose cooling and must be shut down. The failure mode under consideration is misalignment between the pump shaft and the motor shaft during installation.
The effect of misalignment is vibration, accelerated bearing wear, and eventual seal failure. In the short term, the pump may operate with increased noise and reduced efficiency. In the medium term, the bearings fail and the pump seizes. In the long term, if the misalignment is not corrected, the pump may fail catastrophically, causing a loss of cooling and an engine shutdown. Severity is rated 8, because a loss of cooling can cause engine damage and a loss of propulsion. Occurrence is rated 4, because misalignment is a common installation error when alignment tools are not used. Detection is rated 5, because vibration monitoring is not always installed on cooling pumps, and the misalignment may not be detected until the bearings begin to fail. The RPN is 8 × 4 × 5 = 160.
A second failure mode is incorrect pipe connection to the pump inlet, resulting in restricted flow. The effect is reduced pump capacity and possible cavitation. Severity is rated 6, because reduced cooling capacity may not immediately endanger the engine but will reduce its operating margins. Occurrence is rated 3, because the pipe connection is a standard fitting and the error is not common. Detection is rated 4, because the flow restriction may be detected during commissioning tests. The RPN is 6 × 3 × 4 = 72.
The first failure mode has the higher RPN and would receive priority. A reasonable corrective action would be to require laser alignment of the pump and motor during installation, with a verification check by a second technician. This reduces the occurrence rating from 4 to 2 and the detection rating from 5 to 2, lowering the RPN to 32. The cost of the laser alignment tool is small compared to the cost of a pump failure at sea.
Chapter Summary
Machinery, piping, and outfitting present a different risk profile than hull structure production. The failure modes are less about structural collapse and more about system unreliability, installation error, and schedule delay. Published FMEA studies have examined main engine systems on offshore supply vessels, lubricating oil systems on cargo ships, turbocharger systems on cruise ships, pipe manufacturing processes in Brazilian shipyards, piping leakage in Finnish propulsion systems, and outfitting work on Indonesian naval vessels.
The common thread across these studies is that FMEA works best when it is scoped to a specific system or process and when the team includes people who understand both the technical and the practical aspects of the work. The ferry construction study demonstrated that different stakeholders perceive risk differently, and that a complete FMEA must capture those different perspectives. The Finnish piping study showed how FMEA can drive design changes that reduce component count and simplify installation. The Korean hatchway study showed how FMEA can be combined with QFD to identify the components that matter most for both performance and safety.
Chapter 6: Case Study – Integrating FMEA with Bayesian Networks for Ferry Construction
The Problem with a Snapshot
Traditional FMEA produces a snapshot. It captures the state of risk at the moment the analysis is performed, using the best information available at that time. Severity, occurrence, and detection ratings are assigned. RPNs are calculated. Recommendations are made. The document is signed, filed, and, all too often, forgotten.
The problem with a snapshot is that construction does not stand still. A shipyard that begins building a ferry in January will have different information about risk by June. A vendor that promised delivery in March may have slipped to May. A welding procedure that worked perfectly on the first ten blocks may produce defects on the eleventh because the ambient temperature has dropped or a new welder has joined the crew. A component that was rated "rare" in occurrence may have failed twice in the last month. The static FMEA cannot capture this. It tells you what was true when the analysis was performed. It does not tell you what is true now.
This is the gap that Bayesian networks are designed to fill. A Bayesian network is a probabilistic model that represents variables and the dependencies between them. When new data becomes available, the network updates the probabilities of all connected variables. An FMEA that feeds into a Bayesian network becomes a living risk model, one that learns from the construction process itself.
The Indonesian ferry construction study, published by Ariany, Pitana, and Vanany in 2024, is one of the clearest demonstrations of this integration in a shipbuilding context. The study examined the construction of a 600 DWT Ro-Ro ferry in an Indonesian shipyard and used FMEA to establish initial risk priorities, then used a Bayesian network to update those priorities as construction progressed. The results offer a practical template for how shipyards can move from static risk assessment to dynamic risk management.
The Vessel and the Shipyard
The vessel at the center of the study was a 600 deadweight tonne Ro-Ro ferry, a type of vessel common in the Indonesian archipelago. Ro-Ro ferries are the workhorses of inter-island transport in Indonesia, carrying vehicles, passengers, and cargo between islands that have no road connection. They are built in Indonesian shipyards, often under contract to state-owned ferry operators, and they are subject to the schedule pressures that characterize shipbuilding in developing economies.
The study was conducted at a shipyard that was building this ferry as a new construction project. The yard had experience with similar vessels, but each new build carries its own risks. Supply chains shift. Workforce composition changes. Design details that worked on the previous vessel may not work on the next one. The study's authors noted that the 600 DWT shipbuilding project involved "various risks that may affect the schedule and results." The purpose of the research was to identify those risks, quantify them, and provide a method for updating the risk picture as construction proceeded.
The data collection involved field observations and interviews with three distinct groups within the shipyard: the quality control team, the project leader, and production management. This tripartite structure is significant. It reflects the reality that different departments within a shipyard have different perspectives on risk. The quality control team is concerned with defects and rework. The project leader is concerned with schedule and budget. Production management is concerned with labor productivity and workflow continuity. A risk assessment that captures only one perspective will miss the concerns of the others.
How FMEA Established the Baseline
The first step in the study was a conventional FMEA. The researchers worked with the three stakeholder groups to identify potential failure modes in the ferry construction process. They assessed severity, occurrence, and detection for each failure mode and calculated RPNs. The results, as reported in the study, revealed a clear hierarchy of risk.
The highest RPN in the study, 519.49, was associated with delays in the assembly, fabrication, and erection processes, assessed from the perspective of the project leader. This is a schedule risk rather than a safety risk, but in the context of a fixed-price shipbuilding contract, it is a serious one. A delay in hull assembly cascades into outfitting, commissioning, and sea trials. It can trigger penalty clauses, damage the shipyard's reputation, and strain relationships with the ferry operator.
The second-highest RPN, 366.18, was associated with delays in the arrival of main engines, auxiliary engines, pumps, and other mechanical equipment, assessed from the quality control perspective. This is a supply chain risk. The quality control team was concerned not only about the schedule impact of late equipment but also about the quality impact. When equipment arrives late, installation is rushed, and rushed installation is more likely to produce defects.
The third-highest RPN, 317.37, was also related to assembly and erection delays, but assessed from the production leadership perspective. The production leadership's concern was the productivity of the workforce. If assembly is delayed, workers are idle or reassigned, and the yard loses the efficiency that comes from a steady workflow.
The study's risk matrix classified component delays in ship hull work as high risk, machining work as medium risk, and electrical work as low risk. This ranking is consistent with the practical reality of ship construction in a yard that is building a vessel type it has built before. The hull is the first major structure to be assembled, and it is the most schedule-critical. Electrical work comes later and has more float in the schedule.
Why Bayesian Networks Were Needed
The FMEA results were useful, but they were static. The RPN values reflected the risk picture at the time the analysis was performed. The researchers recognized that the picture would change as construction progressed. A component that was rated "rare" in occurrence might fail more frequently than expected. A supply chain that was rated "moderate" in occurrence might deteriorate or improve. The FMEA could not capture these changes.
The Bayesian network provided the mechanism for updating. A Bayesian network is a directed acyclic graph in which nodes represent variables and edges represent probabilistic dependencies. Each node has a conditional probability table that specifies the probability of the node's state given the states of its parents. When new evidence is observed, the network propagates that evidence through the graph, updating the probabilities of all connected nodes.
In the ferry construction study, the Bayesian network was structured around the risk factors identified in the FMEA. The FMEA occurrence ratings were used as the basis for the prior probabilities in the network. The network was then weighted against the list of risks, and as new data appeared during construction, the likelihood of failure for each risk was updated.
This integration solved a problem that had plagued shipyard risk assessment for years. Traditional FMEA requires expert judgment to assign occurrence ratings, and those judgments are often based on historical data that may not be relevant to the current project. A Bayesian network allows the initial expert judgment to be refined by actual project data. The expert judgment provides the starting point. The data provides the correction.
What the Bayesian Network Revealed
The study's findings, as reported in the published abstract, were nuanced. Most risks were considered "rare" in terms of likelihood and "insignificant" in terms of consequence, indicating that despite potential obstacles, the impact on the project was expected to be minimal. This is a more optimistic picture than the raw FMEA RPNs might suggest. The high RPNs for assembly and erection delays reflected the severity of those delays if they occurred, not the likelihood that they would occur. The Bayesian network, by incorporating the actual occurrence data from the project, showed that the likelihood of the most severe delays was lower than the FMEA's occurrence ratings had implied.
However, several risks with "minor" effects were identified, and the study noted that these highlighted the importance of effective risk planning and mitigation. These were not the risks that would sink the project, but they were the risks that would erode its margins. A minor delay in the arrival of a pump. A minor quality issue in a weld. A minor communication breakdown between departments. Each one, on its own, was manageable. Taken together, they represented the difference between a project that met its schedule and one that slipped.
The study's authors were explicit about the limitations of their work. They noted that the integration of FMEA and Bayesian networks "still needs to be improved, especially in the shipping industry." They suggested that the method could be developed further by making applications to control the procurement of materials at the beginning and during the construction and evaluation process at the end. This is a call for a closed-loop system. FMEA feeds the Bayesian network. The network updates as construction proceeds. The updated probabilities feed back into procurement decisions and production planning. The cycle continues through the end of the project, and the lessons learned feed into the next vessel.
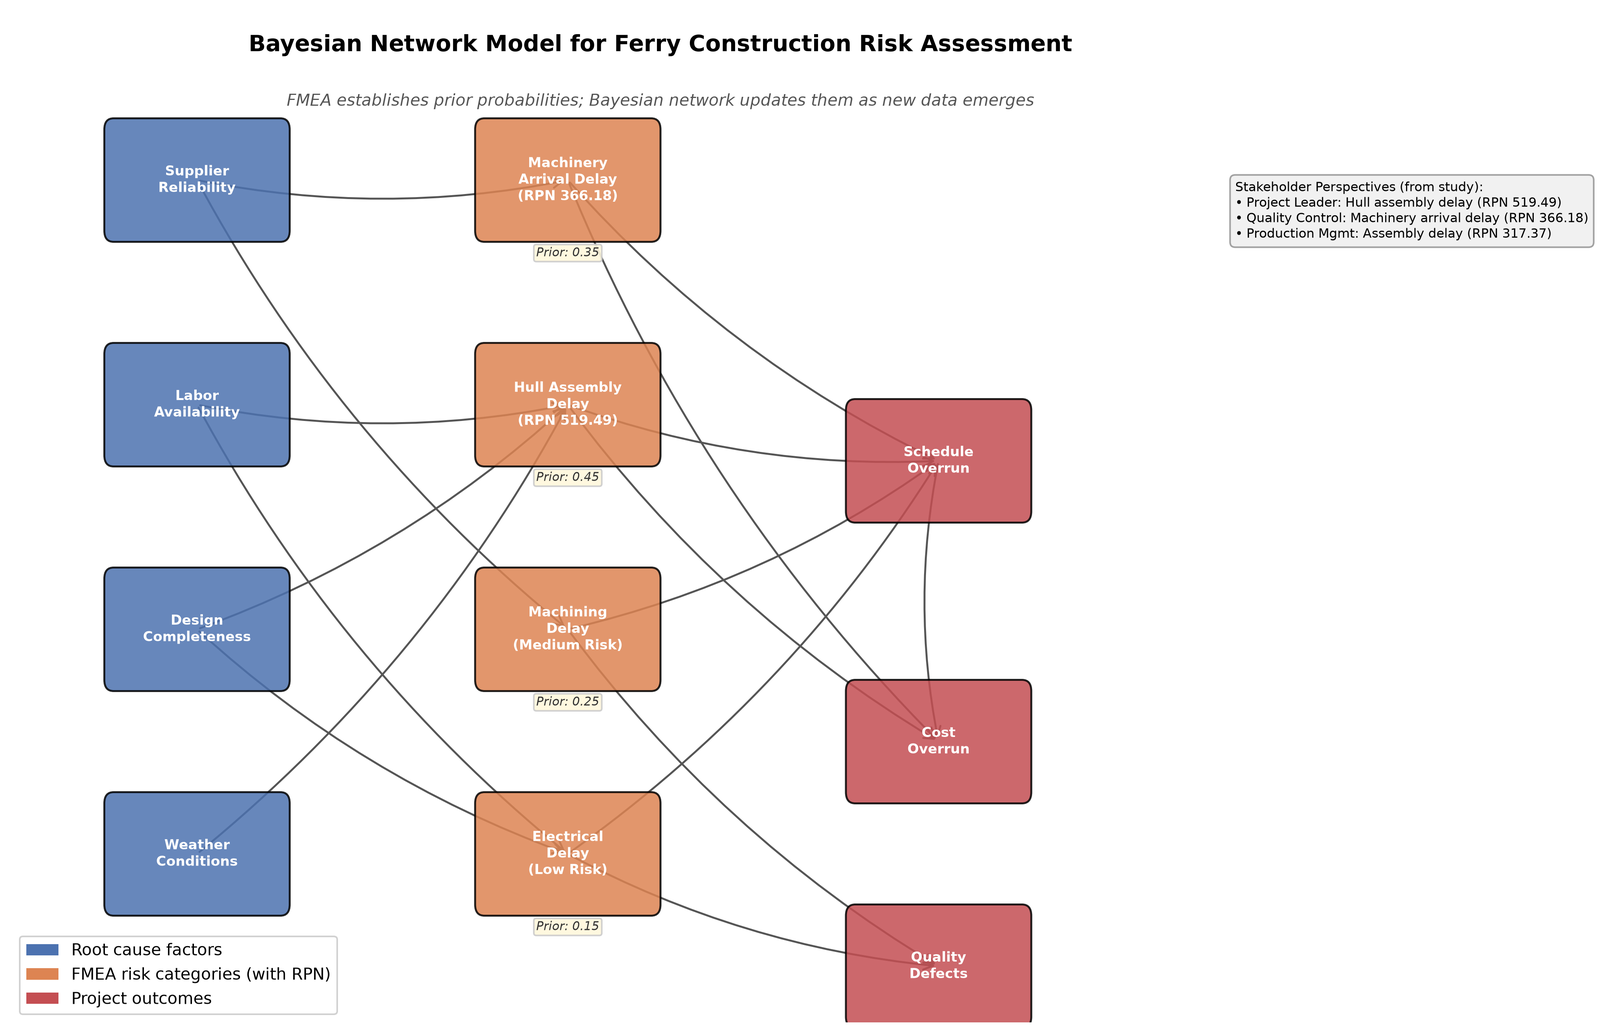
The Communication Dimension
One of the most important findings of the study was not about probabilities or RPNs. It was about communication. The study's abstract states that the results of the risk assessment "assist in understanding and managing project risk, stress the importance of communication and coordination between teams, and enable better contingency planning and more effective project management."
This finding emerged from the structure of the study itself. By interviewing three separate groups, the quality control team, the project leader, and production management, the researchers revealed where their risk perceptions diverged. The quality control team was most concerned about equipment arrival delays. The project leader was most concerned about assembly and erection delays. Production leadership was also concerned about assembly delays, but for different reasons than the project leader. The project leader was worried about the contract schedule. Production leadership was worried about workforce productivity.
These divergent concerns are not a problem to be solved. They are a reality to be managed. A shipyard that assumes all departments share the same risk priorities will be surprised when a mitigation action that satisfies one department creates problems for another. An FMEA that captures only the project leader's perspective will produce a risk register that the quality control team does not recognize as their own. An FMEA that captures only the quality control perspective will miss the schedule risks that keep the project leader awake at night.
The Bayesian network integration addressed this by making the different perspectives explicit. The network was structured to include the risk factors from all three groups, and the updates reflected data from all three. The result was a risk picture that no single department could have produced alone. The study's emphasis on communication and coordination is a reminder that FMEA is not just a technical exercise. It is a social one. The method works best when it brings different perspectives into the same room and forces them to confront the same questions.
A Conceptual Model of the Bayesian Network
To make the integration concrete, consider a simplified conceptual model of the Bayesian network used in the ferry study. The network would have nodes for the major risk categories identified in the FMEA: hull assembly delay, machinery arrival delay, machining delay, and electrical delay. Each of these nodes would be connected to upstream causes, such as supplier reliability, labor availability, design completeness, and weather conditions. Each would also be connected to downstream effects, such as schedule overrun, cost overrun, and quality defects.
The conditional probability tables for these nodes would be populated initially from the FMEA occurrence ratings. The FMEA might have rated the occurrence of machinery arrival delay as 4, which translates to a moderate probability. The Bayesian network would use that as the prior probability. As construction progressed, if the machinery actually arrived on time, the network would update the probability of machinery arrival delay downward. If the machinery arrived late, the network would update it upward. The updated probability would then propagate to the downstream effect nodes, changing the estimated probability of schedule overrun.
This is not a complex model in principle. It is a structured way of learning from experience. The FMEA provides the structure. The Bayesian network provides the learning. The shipyard provides the experience.
Chapter 7: Case Study – FMEA and Machine Learning in a Modern Shipyard
The Limits of Expert Judgment
Every FMEA depends on people. A team of engineers sits around a table, considers the failure modes of a system or process, and assigns ratings for severity, occurrence, and detection. The quality of the output depends on the quality of their knowledge, their experience, and their willingness to challenge one another's assumptions. This is not a weakness of the method. It is the method. The best FMEAs are the ones where an experienced welder tells the design engineer something the design engineer did not know.
But expert judgment has limits. A team can only consider so many failure modes before fatigue sets in. The ratings are subjective, and different teams may assign different values to the same failure mode. The analysis is a snapshot, capturing what the team knows at a particular moment but not what the yard might learn as construction proceeds. And when a shipyard builds dozens of vessels over years, the knowledge accumulated in thousands of defect records and inspection reports sits in databases that no FMEA team can fully process.
This is where machine learning enters the picture. A machine learning model can analyze historical defect data, identify patterns that human analysts might miss, and predict which failure modes are most likely to occur in a newbuild. It does not replace expert judgment. It augments it. The expert provides the structure and the context. The algorithm provides the pattern recognition and the scalability.
The most detailed published example of this integration in shipbuilding comes from a study published in Sustainable Materials and Technologies in 2025, conducted at Cemre Shipyard in Yalova, Türkiye. The study, led by researchers including F. Yılmaz, combined FMEA with Random Forest regression to predict defect risk on an LNG-powered fishing vessel. The results were striking, and they point toward a future in which risk assessment is not a periodic document but a continuous, data-driven process.
Cemre Shipyard and the M/V Sunny Lady
Cemre Shipyard is a Turkish shipyard located in the Altınova region of Yalova, on the southern shore of the Sea of Marmara. The yard was founded in 1996 as a painting and outfitting contractor and expanded into a full shipyard with its own facilities in Altınova. The yard has built a range of vessel types, including offshore support vessels, fishing vessels, and ferries, and has ranked among Türkiye's top 500 exporters since 2008.
The vessel at the center of the study was the M/V Sunny Lady, a modern ocean-going fishing vessel equipped with an LNG-based mild hybrid propulsion system. The Sunny Lady is part of a series of vessels built at Cemre for the Norwegian fishing industry. The vessel's LNG propulsion makes its structural and systems configuration more complex than standard fishing vessels, and that complexity produces a correspondingly complex risk profile. The study's authors noted that the dataset was derived from the construction phase of this vessel, with defects recorded through real-time inspection data provided by the shipyard's design, quality, and production departments, as well as external stakeholders.
The Dataset: 489 Defects and Four Risk Factors
The foundation of the study was a dataset of 489 documented production defects recorded during the construction of the Sunny Lady. These defects were not hypothetical failure modes identified in a meeting room. They were real defects that had occurred on the shop floor, been documented by inspectors, and been corrected at a known cost. The dataset represented a record of what actually went wrong, not what might go wrong.
Each defect was categorized into one of seven error groups: deformation, inappropriate production, defective part usage, drawing-production incompatibility, material damage, faulty welding and surface treatment, and missing materials. The distribution of defects across these categories was uneven. Deformation and inappropriate production emerged as the most frequent and costly error types, making them the focal points of the subsequent analysis.
The study's methodology departed from traditional FMEA in a significant way. Instead of using the standard severity, occurrence, and detection ratings, the researchers assessed each defect using four risk factors: frequency of occurrence, cost of correction, time loss, and stage of detection. Each factor was rated on a scale from 1 to 5, and the Risk Priority Number was calculated as the product of these four factors rather than the traditional three. The formula was:
RPN = F × C × T × S
where F is frequency, C is cost impact, T is time loss, and S is stage of detection. This modification was calibrated through a structured consensus process involving experienced shipyard engineers, quality control staff, and project planners, with internal benchmarks and historical production data used to anchor each level of the scale. Cost ratings were derived from engineering estimates, time loss was triangulated from quality logs and project schedules, and frequency was determined by recurrence patterns in similar vessel builds.
The four-factor RPN produces a theoretical maximum of 625 (5 × 5 × 5 × 5) rather than the traditional 1,000 (10 × 10 × 10). The researchers then grouped defects into three risk levels: Level 1 for RPN greater than 25, requiring immediate corrective action and cause-effect analysis; Level 2 for RPN between 10 and 25; and Level 3 for RPN below 10.
Of the 489 defects initially collected, only 185 were structured with complete information on all four risk factors. This filtered dataset was used for training the machine learning models. The reduction from 489 to 185 is a reminder that data quality is often the limiting factor in data-driven risk assessment. A defect record that is missing the cost of correction or the stage at which the defect was detected cannot be used to train a model. The study's authors acknowledged this limitation, noting that the missing data reduced the size of the training set.
The Random Forest Model
The machine learning component of the study used Random Forest regression. Random Forest is an ensemble learning method that constructs multiple decision trees and aggregates their predictions. Each tree is trained on a random subset of the data and a random subset of the features, which reduces the risk of overfitting and improves the model's ability to generalize to new data. Random Forest is particularly well suited to this application because it can handle non-linear relationships between features and target values, and it provides a measure of feature importance that can be used to interpret the model's predictions.
The model was trained to predict the RPN of a defect based on the four risk factors: frequency, cost, time loss, and stage of detection. The RPN was used as the target variable, and the four factors were used as input features. The model's performance was evaluated using the coefficient of determination (R²) and the mean absolute error (MAE). The reported results were R² = 0.9738 and MAE = 1.3470 under current operational conditions.
An R² of 0.9738 means that the model explained 97.38 percent of the variance in the RPN values. In practical terms, this means the model's predictions were very close to the actual RPN values calculated from the defect data. An MAE of 1.3470 means that, on average, the model's predicted RPN differed from the actual RPN by about 1.35 points. Given that RPN values in this dataset ranged up to 625, an average error of 1.35 points is small. The model was highly accurate.
But accuracy alone does not make a model useful. A model that predicts RPN values accurately but cannot explain what drives those values is a black box. The study addressed this by examining feature importance, which measures how much each input variable contributes to the model's predictions. Time loss and frequency emerged as the most significant features influencing RPNs. This finding is intuitive. A defect that causes a large time loss and occurs frequently is more disruptive than a defect that is costly but rare. The model quantified what experienced shipyard managers already knew intuitively, but it did so with a precision that expert judgment alone cannot achieve.
The Critical Defect Categories
The study identified deformation, inappropriate production, and defective part usage as the most critical categories of defects. These three categories accounted for a disproportionate share of the total risk, as measured by RPN.
Deformation refers to the distortion or bending of steel components during fabrication or assembly. It can be caused by welding heat, improper handling, inadequate support during lifting, or errors in the fit-up process. Deformation is a persistent problem in shipbuilding because steel is a material that moves when it is heated and cooled, and controlling that movement requires skill, experience, and careful process planning. A deformed block or panel may require costly rework, and if the deformation is not corrected, it can affect the fit of subsequent components and the structural integrity of the vessel.
Inappropriate production refers to work that is performed incorrectly, whether because the procedure was not followed, the wrong tool was used, or the worker lacked the necessary skill. This category is broad, and it overlaps with other categories. A faulty weld, for example, could be classified as either faulty welding or inappropriate production depending on how the defect is recorded. The fact that inappropriate production ranked among the top categories suggests that process control and training are persistent challenges in the yard.
Defective part usage refers to the installation of a component that does not meet specifications, whether because it was damaged in storage, supplied incorrectly by a vendor, or mixed up with a similar but different part. This category is particularly concerning because defective parts can be difficult to detect once installed. A valve that is the wrong pressure rating may look identical to the correct valve from the outside. A cable that is the wrong gauge may function normally until it is loaded to its limit.
The prominence of these three categories is consistent with the findings of other shipyard FMEA studies. Deformation and welding defects are recurring themes in hull production FMEA. The Indonesian welding study discussed in Chapter 4 identified incomplete penetration, crack, and porosity as the dominant welding defects, all of which can result from process conditions that also cause deformation. The Turkish welding FMEA identified cable deformation, excessive air flow, and untidy cable placement as the top failure modes, all of which are production process issues rather than design issues. The machine learning study at Cemre confirms that these are not isolated problems. They are systemic patterns that emerge when defect data is analyzed at scale.
What the Model Revealed That Expert Judgment Missed
The study's improvement scenarios demonstrated the model's capacity to estimate risk reduction potential for high-priority failure modes. The researchers simulated the effect of optimized process conditions on RPN values and found that the model could predict how much risk would be reduced by specific interventions. This is a capability that traditional FMEA does not have. A traditional FMEA identifies failure modes and recommends corrective actions, but it does not quantify the expected risk reduction from those actions. The machine learning model can estimate, for example, that reducing the frequency of deformation defects by 20 percent would reduce the overall RPN by a certain amount. That estimate can be used to prioritize interventions and to justify investment in process improvements.
The study also demonstrated that the model could be integrated with enterprise systems for automated risk monitoring and continuous improvement. This is a significant claim. If the model can be connected to the shipyard's quality management system, it can update its predictions automatically as new defect data is recorded. A defect that occurs today becomes training data for tomorrow's predictions. The FMEA is no longer a document that is written once and filed away. It is a living model that learns from every defect the yard records.
The study's authors framed this as a bridge between expert judgment and data-driven intelligence. The FMEA provides the structure and the domain knowledge. The machine learning model provides the scalability and the pattern recognition. Neither is sufficient alone. An FMEA without data is a structured opinion. A machine learning model without domain knowledge is a black box that may learn spurious correlations. The integration of the two produces something more useful than either could achieve independently.
Limitations and Caveats
The study was honest about its limitations. The dataset of 185 complete records was relatively small for training a machine learning model, and the model was trained on data from a single vessel type at a single shipyard. The authors noted that the model's performance might differ when applied to other vessel types or other yards with different production processes and quality standards. The reported R² of 0.9738 was achieved under current operational conditions, and the model's accuracy might decline if those conditions change significantly.
There is also the question of what the RPN values actually represent. The four-factor RPN used in this study is not the same as the traditional three-factor RPN used in most FMEA applications. The severity rating, which is arguably the most important factor in traditional FMEA because it captures the consequences of failure, is not explicitly included in the four-factor model. The cost factor captures some of the financial consequences, and the time loss factor captures some of the schedule consequences, but neither captures safety or environmental consequences. A defect that causes a small time loss and a moderate cost but creates a safety hazard would not necessarily rank highly in this model. The study's authors did not address this limitation directly, but it is worth noting that any risk assessment model is only as good as the factors it measures.
The filtering of the dataset from 489 to 185 records is another limitation. The 304 records that were excluded because they lacked complete information on all four risk factors might have contained failure modes that were not represented in the training set. If those excluded records were systematically different from the included ones, the model's predictions could be biased. The study did not report an analysis of the excluded records, so it is not possible to assess the magnitude of this potential bias.
Finally, the study was conducted at a single shipyard with a relatively advanced data collection system. Cemre Shipyard records defects in a structured database with fields for cost, time loss, detection stage, and frequency. Many shipyards do not have this level of data discipline. A yard that records defects only as narrative descriptions in a paper logbook cannot train a machine learning model. The study's approach is promising, but its transferability depends on the yard's data infrastructure.
A Visual Representation of the Model
To illustrate the model's performance, consider a scatter plot comparing predicted RPN values against actual RPN values for the test dataset. Each point represents a defect. The x-axis shows the actual RPN calculated from the four risk factors. The y-axis shows the RPN predicted by the Random Forest model. If the model were perfect, all points would lie on a diagonal line running from the origin to the top right corner. The closer the points cluster to that line, the more accurate the model.
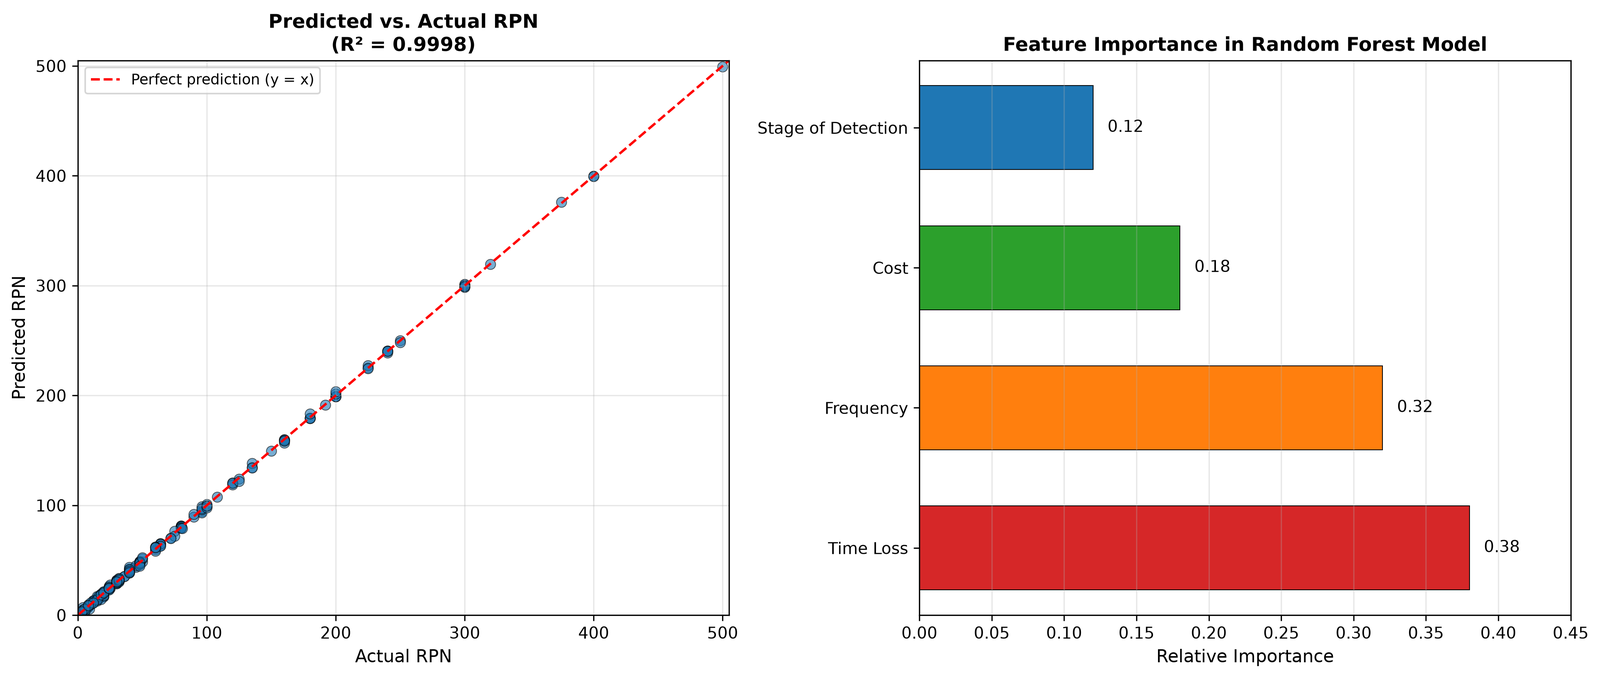
Chapter 8: Classification Society Requirements and Regulatory Drivers
The Shift from Voluntary to Mandatory
For the first four decades of its existence, FMEA was a voluntary tool. Engineers used it when they wanted to, on systems they chose, to the depth they judged appropriate. That changed in the maritime industry during the 1990s, when classification societies began requiring FMEA as a condition of class for dynamic positioning systems. The shift was driven by the recognition that redundancy, which DP systems depend on for safety, cannot be verified by inspection alone. A vessel can have two thrusters, two generators, and two switchboards and still lose position if a hidden common-cause failure defeats the redundancy. The only way to prove that redundancy is real is to analyze the system failure by failure, and FMEA is the method for doing that.
Today, FMEA is embedded in the class rules of every major classification society. For a vessel to receive a DP 2 or DP 3 notation, the builder or owner must submit an FMEA that demonstrates compliance with the society's redundancy requirements. The FMEA is not a supporting document. It is the evidence. Without it, the notation is not granted, and the vessel cannot operate in the roles that require that notation.
This chapter examines the regulatory framework for FMEA in shipbuilding. It covers the International Maritime Organization's guidelines, which provide the overarching framework, and the specific requirements of three major classification societies: the American Bureau of Shipping, DNV, and Lloyd's Register. It also discusses the documentation shipyards must submit, the testing that verifies the FMEA's conclusions, and the differences in methodology among the societies.
The IMO Framework
The International Maritime Organization provides the regulatory foundation for DP FMEA through two circulars. The first, MSC/Circ.645, was issued in 1994 and established FMEA as the primary means of demonstrating redundancy in DP systems. The second, MSC.1/Circ.1580, was issued in June 2017 and superseded the earlier circular with more detailed guidance. The 2017 circular is the document that classification societies now reference in their rules, and it defines the equipment classes that form the basis of DP notations worldwide.
MSC.1/Circ.1580 defines three equipment classes. Equipment Class 1 is for vessels where a loss of position may occur in the event of a single fault. Equipment Class 2 is for vessels where a loss of position is not to occur in the event of a single fault of an active component or system, such as generators, thrusters, switchboards, or remote-controlled valves. Equipment Class 3 is for vessels where a loss of position is not to occur in the event of a single fault of any component, including static components such as cables and pipes, and where the vessel must also survive a worst-case failure such as the flooding of one watertight compartment or the fire in one fire subdivision.
The circular also introduces the concept of hidden failures, which it defines as failures that are not immediately evident to operations or maintenance personnel and that have the potential to prevent equipment from performing an on-demand function. A standby pump that has failed silently, a UPS with a dead battery, or a protective relay that will not operate when called upon are all examples of hidden failures. The FMEA must identify these hidden failures and determine whether they could defeat the redundancy that the DP system depends on. The circular requires that hidden failures be revealed by appropriate alarms, or, where alarms are impractical, that periodic testing be established to detect them.
The IMO circular also addresses inadvertent acts, which it defines as actions taken by an operator in an unintentional manner. No single inadvertent act should lead to a loss of position or heading, and the FMEA must consider the potential for such acts subsystem by subsystem. The circular recommends that systems be designed to require more than one step to carry out a critical action, such as a confirmation prompt before a command is executed.
The classification societies implement these IMO guidelines through their own rules and notations. The IMO circular provides the framework. The class societies provide the specifics. A review of FMEA in marine engineering, published in the Journal of Traffic and Transportation Engineering, noted that while the basic framework is shared, there are significant differences in implementation methodology among the major classification societies, including those of China, the United States, and Norway.
American Bureau of Shipping
The American Bureau of Shipping issues a Guide for Dynamic Positioning Systems that specifies the requirements for DP notations and the FMEA that supports them. The ABS guide defines two DP notations that require FMEA: DPS-2 and DPS-3. A vessel with either notation is required to be single-fault tolerant, meaning it must be able to maintain position and heading under specified environmental conditions during and after any single fault of the DP system.
The ABS guide states that the purpose of the FMEA is to indicate whether the DP system meets the requirements of the relevant notation and complies with the vessel's Worst Case Failure Design Intent. The Worst Case Failure is defined as the identified single fault in the DP system that results in the maximum effect on DP capability, as determined through the FMEA study. The Worst Case Failure Design Intent describes the minimum amount of propulsion and control equipment that must remain operational following that worst-case failure.
The objectives of the ABS DP FMEA are threefold: to identify and provide recommendations to eliminate or mitigate the effects of all single faults and common mode failures that would cause a total or partial loss of station-keeping capability; to demonstrate effective redundancy; and to identify potential hidden failures and determine the effects of a second failure. The guide also specifies that the FMEA is to be performed based on the ABS guide itself, IMCA M 166, IMCA M 178, IEC 60812, the MTS "DP Vessel Design Philosophy Guideline," and Annex 4 of the IMO High Speed Craft Code.
ABS requires two FMEAs for DP vessels: one covering the main DP control systems and another for all other systems onboard related to DP operations. The FMEA is only applicable to DPS-2 and DPS-3 notations. For DPS-0 and DPS-1 vessels, an FMEA is not required, because those notations permit a loss of position in the event of a single fault.
The documentation that must be submitted to ABS includes the FMEA report itself, with worksheets and a verification plan; a narrative and drawings of the system functional description and control; a description of all systems associated with the dynamic positioning of the vessel; and a functional block diagram showing their interaction with each other. ABS also requires that operations, maintenance, inspection, testing, and emergency manuals be provided to confirm that the findings of the FMEA have been incorporated into the equipment operating phases. The FMEA test procedures are to be developed in the FMEA analysis, and operational testing is to demonstrate the level of redundancy established by the FMEA.
DNV
DNV implements the IMO guidelines through its DYNPOS notation system. The DNV rules for classification specify that for the DYNPOS(AUTR) notation, loss of position is not to occur in the event of a single failure in any active component or system. This corresponds to IMO Equipment Class 2. For the higher notation DP(AAA), which corresponds to Equipment Class 3, the vessel must also survive the failure of static components and a worst-case failure such as flooding or fire.
The DNV rules require that the identified technical prerequisites for achieving the required failure tolerance and redundancy be presented in a collected list within the FMEA. DNV also specifies documentation requirements for the FMEA test program, which must be included in the FMEA submission. The rules address separation analysis, which examines whether redundant components are physically separated so that a single event, such as a fire or flooding, cannot disable both.
DNV's notation system uses different terminology than ABS and Lloyd's Register. Where ABS uses DPS-2 and DPS-3, and Lloyd's Register uses DP2 and DP3, DNV uses DYNPOS(AUT), DYNPOS(AUTR), and DYNPOS(AUTRO). The correspondence between these notations and the IMO equipment classes is defined in DNV's rules. A comparison published in the DNV rules states that for class notation AUTR, the loss of position is not to occur in the event of a single failure in any active component or system, and that for assignment of DP(AA) and DP(AAA) notations, a Failure Mode and Effects Analysis is to be submitted.
The DNV rules also address closed bus-tie operations, which are configurations where the main switchboard bus ties are closed during DP operations. This configuration can improve fuel efficiency but reduces the redundancy of the power system. DNV requires that any potential closed bus-tie modes be described and documented in the required DP FMEA, and that the system integrity be documented in the FMEA and supporting documentation.
Lloyd's Register
Lloyd's Register implements the IMO guidelines through its Rules and Regulations for the Classification of Ships, Part 7, Chapter 4, which covers dynamic positioning systems. Lloyd's Register uses the notation system DP1, DP2, and DP3, which corresponds directly to the IMO equipment classes. DP1 vessels are not required to have an FMEA. DP2 and DP3 vessels must submit an FMEA as a condition of class.
The Lloyd's Register requirements for the FMEA content align closely with the IMO circular and the IMCA guidelines. The FMEA must identify the Worst Case Failure Design Intent and the Worst Case Failure, and it must demonstrate that the vessel's redundancy meets the requirements of the notation. The FMEA must include a governing, summary statement on the vessel's compliance with the rules and guidelines for the notation of the classification society.
Lloyd's Register also requires DP FMEA proving trials, which are periodic tests that verify the FMEA's conclusions in practice. The DP FMEA proving trials are conducted every five years, and annual DP trials are conducted within three months before or after each anniversary date of the Dynamic Positioning Verification Acceptance Document. These trials simulate the failure modes identified in the FMEA and observe the system's response. If the system does not respond as predicted, the FMEA must be revised, and the design or operating procedures must be changed.
Comparison of Requirements
While the three societies implement the same IMO framework, there are differences in their specific requirements and methodologies. A review published in 2026 summarized the similarities and differences in FMEA implementation among the classification societies of China, the United States, and Norway. The review noted that while the basic framework is shared, the societies differ in their documentation requirements, their interpretation of redundancy, and their testing regimes.
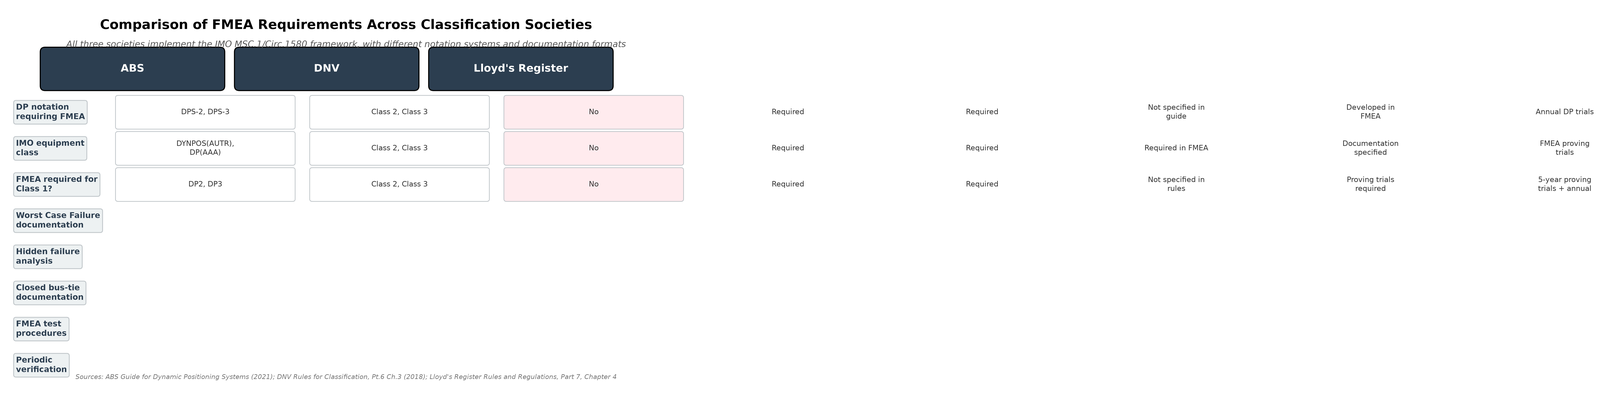
The Documentation Package
A DP FMEA submitted to a classification society is not a short document. It typically runs to dozens or hundreds of pages, depending on the complexity of the vessel and the DP system. The FMEA report includes several components. The narrative section describes the vessel's DP system, its functional blocks, and its modes of operation. The worksheets section lists every identified failure mode, with columns for cause, effect, severity, occurrence, detection, and RPN. The analysis section traces the effects of each failure mode through the system and determines whether redundancy is maintained. The recommendations section lists corrective actions for failure modes that compromise redundancy. The verification plan section describes the tests that will be performed to demonstrate that the FMEA's conclusions are correct.
The FMEA must also include a common mode and common cause failure analysis, which examines areas where a single event could cause redundant equipment to fail. This analysis should incorporate the vessel's planned maintenance system records and non-conformity reports to identify any historical evidence of common-cause failures.
The FMEA Proving Trials
The FMEA is not accepted on the basis of the document alone. The classification society requires that the FMEA's conclusions be verified through testing. These tests, known as FMEA proving trials, are conducted during sea trials or during dedicated DP trials. The trials simulate the failure modes identified in the FMEA and observe the system's response. A failure mode that the FMEA predicted would not cause a loss of position is tested to confirm that prediction. A failure mode that the FMEA predicted would cause a loss of position is tested to confirm that the vessel's procedures for responding to that failure are adequate.
The proving trials are conducted with the classification society's surveyor present. The surveyor observes the tests and confirms that the results match the FMEA's predictions. If a test reveals a discrepancy, the FMEA must be revised, and the design or the operating procedures must be changed. The proving trials are not a one-time event. They are repeated periodically to confirm that the vessel's DP system continues to comply with the FMEA's conclusions. The interval between proving trials varies by society. Lloyd's Register requires proving trials every five years, with annual trials in between.
What the Regulatory Framework Means for Shipyards
The classification requirements impose a significant burden on shipyards. A yard that is building a DP 2 or DP 3 vessel must produce an FMEA that satisfies the class society's rules. This requires expertise that many yards do not have in-house. Large yards may have a dedicated FMEA team. Smaller yards typically hire external consultants or rely on the DP system vendor to produce the FMEA. The vendor has detailed knowledge of the control system and the thrusters, but may not have detailed knowledge of the vessel's auxiliary systems, such as cooling, lubrication, and fuel supply. The FMEA must cover those systems as well, because a failure in an auxiliary system can defeat the redundancy of the main DP system.
The regulatory framework also creates a lifecycle obligation. The FMEA is not a document that is produced once and filed away. It must be updated when the vessel's configuration changes, and it must be verified through periodic trials. A vessel that is modified without updating the FMEA may lose its class notation. A vessel that fails a proving trial may be required to correct the deficiency before it can continue operating in DP mode. The FMEA is a living document, and the classification society is the gatekeeper that ensures it stays current.
Chapter Summary
The regulatory framework for FMEA in shipbuilding is built on the IMO's MSC.1/Circ.1580, which defines the equipment classes and the requirements for DP FMEA. Classification societies implement this framework through their own rules and notations. ABS requires FMEA for DPS-2 and DPS-3 vessels and specifies the objectives and documentation requirements in its DP guide. DNV requires FMEA for DYNPOS(AUTR) and DP(AAA) notations and specifies documentation requirements for the FMEA test program. Lloyd's Register requires FMEA for DP2 and DP3 vessels and requires proving trials every five years.
While the notation systems and documentation formats differ, the underlying requirements are the same across all three societies. The FMEA must identify single faults, common-cause failures, and hidden failures. It must demonstrate that redundancy is effective and that the vessel can survive the worst-case failure. It must be verified through periodic testing. The regulatory framework transforms FMEA from a voluntary engineering tool into a mandatory condition of class. For shipyards building DP vessels, the FMEA is not optional. It is the evidence that the vessel is fit for the role it is designed to perform.
Chapter 9: Challenges and Limitations of FMEA in Shipbuilding
The Tool That Is Not a Cure
Every method has a boundary. A hammer is excellent for driving nails and useless for tightening bolts. FMEA is no different. It is a structured way of thinking about failure, and like any structured way of thinking, it has assumptions, blind spots, and failure modes of its own. A shipyard that treats FMEA as a guarantee rather than a tool will be disappointed. A shipyard that understands its limitations will use it better.
The published literature on FMEA in maritime and manufacturing contexts is unusually candid about these limitations. Researchers who use the method are often the first to point out where it falls short. This chapter gathers those criticisms and examines them in the context of shipbuilding. It covers the problems with the Risk Priority Number, the subjectivity of expert judgment, the scarcity of failure data for novel vessel types, the difficulty of analyzing human error, and the challenge of modeling complex systems where failures interact in non-linear ways. It also discusses the methods that researchers and shipyards have developed to work around these limitations.
The Risk Priority Number Problem
The Risk Priority Number is the most criticized element of traditional FMEA. The RPN is calculated by multiplying three ratings: severity, occurrence, and detection. Each rating is typically on a scale from 1 to 10, so the RPN ranges from 1 to 1,000. Higher RPNs indicate higher risk and therefore higher priority for corrective action.
The problem is that the multiplication assumes the three factors are equally weighted. A failure mode with severity 10, occurrence 1, and detection 1 has the same RPN as a failure mode with severity 1, occurrence 10, and detection 1, and the same RPN as a failure mode with severity 1, occurrence 1, and detection 10. All three equal 10. But these failure modes are not equally risky. A severity of 10 means the consequences could be catastrophic. A severity of 1 means the consequences are negligible. Treating them as equivalent because the product happens to be the same is a flaw that has been recognized in the literature for decades.
A 2015 study on yacht fuel system safety stated the problem plainly: "The assumption that the RPN factors are equally weighted leads to over simplification. Furthermore, the RPN has high duplication rates and does not consider ordered weight rules." The duplication problem is significant. Because the RPN is a product of three integers between 1 and 10, there are only a limited number of possible RPN values, and many different combinations of severity, occurrence, and detection produce the same product. A severity of 2, occurrence of 6, and detection of 5 has the same RPN as a severity of 3, occurrence of 4, and detection of 5. Both equal 60. A shipyard that prioritizes failure modes by RPN alone may find itself unable to distinguish between genuinely different risks.
The mis-prioritization problem is not theoretical. A 2025 study on enhanced FMEA for marine machinery systems found that "traditional RPN can mis-prioritize failure modes" and that the classical FMEA approach "has been criticized as having some flaws, which include subjective risk prioritization and lack of comprehensive evaluation." The study's authors developed an alternative methodology using fuzzy AHP and fuzzy TOPSIS to address these limitations. Their conclusion was that the traditional method, while widely used, does not provide the targeted, expert-driven insights that high-stakes marine engineering decisions require.
A review published in the Journal of Traffic and Transportation Engineering in 2026 summarized the state of the field. It noted that FMEA/FMECA has been widely applied to ship power systems but that current applications face difficulties and problems, and that research hotspots are focused on combining FMEA with the Analytic Hierarchy Process to scientifically determine the weights of the RPN parameters and improve their accuracy and objectivity. The message is consistent across the literature: the RPN is a useful heuristic, but it is not a precise instrument.
Subjectivity and the Expert Judgment Problem
FMEA is a team activity. The ratings for severity, occurrence, and detection are assigned by people, and people bring their own experiences, biases, and blind spots to the table. Two teams analyzing the same system may produce different ratings and therefore different RPNs. This is not a bug in the method. It is an inherent feature of any qualitative risk assessment.
The problem is that the subjectivity is often unacknowledged. A shipyard that treats its FMEA ratings as objective measurements will make decisions based on numbers that are not as solid as they appear. A 2025 study on sustainable shipbuilding noted that "traditional FMEA, despite its widespread use, often lacks objectivity and scalability" and that "one of its major limitations is the reliance on subjective expert judgment, which can introduce inconsistencies and hinder scalability in complex, data-rich environments like shipyards."
The subjectivity problem is compounded by the fact that different experts may have different levels of familiarity with the system being analyzed. A senior engineer who has worked on similar systems for twenty years will assign occurrence ratings differently than a junior engineer who is seeing the system for the first time. The literature on maritime FMEA acknowledges this. A study on expert weighting in maritime risk assessment found that "some failure modes are highly sensitive to expert input, underscoring the need for objective weighting in expert-based decision-making models."
The methods used to address subjectivity fall into two broad categories. The first is to make the subjectivity explicit by using structured elicitation techniques that force experts to justify their ratings and to reconcile differences. The second is to use mathematical methods, such as fuzzy logic, that represent uncertainty explicitly rather than forcing experts to commit to a single number. Both approaches have merit, and both are used in shipbuilding FMEA.
Data Scarcity and the Novel Vessel Problem
Traditional FMEA assigns occurrence ratings based on historical failure data. A shipyard that has built fifty similar vessels has a database of failure rates that can inform those ratings. A shipyard that is building the first vessel of its kind has nothing. The occurrence ratings become guesses, informed by experience with similar systems but not grounded in data from the specific application.
The shipbuilding industry is particularly vulnerable to this problem because so much of its work is customized. A bulk carrier and a cruise ship share certain systems, but the specific configurations, operating conditions, and production processes are different. A shipyard that builds a series of sister ships can reuse FMEA data from one vessel to the next. A shipyard that builds one-off vessels cannot.
The problem is most acute for novel vessel types. Hydrogen fuel cell vessels, ammonia-fueled vessels, autonomous ships, and battery-electric ferries all introduce failure modes that have little or no historical precedent. A 2025 study on rotor sail fault diagnosis noted that "constructing data-driven Condition Based Maintenance systems is difficult due to the scarcity of empirical failure data" in the maritime industry. A study on FMEA-Bayesian network integration for ship systems stated that "reliable historical failure data is lacking, which limits the development of robust probabilistic models."
The scarcity of data has a direct effect on FMEA quality. When occurrence ratings are based on judgment rather than data, they are more likely to be wrong. And when they are wrong, the RPNs that depend on them are wrong. A failure mode that is rated occurrence 2 because no one remembers it happening may actually have an occurrence rate closer to 5, and the RPN that ranks it low will direct attention away from a genuine risk.
Human Factors: The Gap in the Analysis
FMEA was developed to analyze hardware. A valve fails. A pump seizes. A weld cracks. The method is well suited to these failure modes because they are physical, observable, and relatively predictable. Human error is a different kind of failure. It is behavior-dependent, context-sensitive, and difficult to quantify.
The maritime industry's safety record reflects this gap. A comprehensive risk assessment of enclosed space operations on ships found that "human reliance-based procedures have a dominant role in the vulnerabilities" and that "the most critical risk components are procedural and human failures" rather than equipment failures. The failure mode "limited procedural traceability and auditability" emerged as the most critical risk factor, with a high criticality value of 67.38. This is a human and organizational failure, not a hardware failure. Traditional FMEA, with its focus on component failure modes, does not naturally capture it.
Other studies confirm the pattern. A study on watch officer fatigue identified the highest RPN (256) as associated with "physical and mental fatigue experienced by watch officers during the 00:00-04:00 shift." A study on vessel traffic services found that risks were caused by "lack of situation awareness, lack of knowledge and experience and commercial pressures." These are not failures of equipment. They are failures of people, and they are systematically underrepresented in FMEA analyses that focus on hardware.
The literature acknowledges this gap. A review of FMEA in marine engineering noted that human factors are often underrepresented, even for systems where human error is a significant contributor to risk. The integration of human reliability analysis methods with FMEA is an active area of research, but it is not yet standard practice in shipyards.
Complexity and Non-Linear Interactions
A ship is a system of systems. The propulsion system interacts with the electrical system. The electrical system interacts with the control system. The control system interacts with the operator. A failure in one system can propagate to another in ways that are not obvious from a component-level analysis.
Traditional FMEA is a bottom-up method. It starts with components, identifies their failure modes, traces the effects upward, and assesses the consequences at the system level. This approach works well when the system is relatively linear and the interactions between components are well understood. It works less well when the system is complex and the interactions are non-linear.
The problem is that FMEA does not capture the indirect relationships between failures. A failure in one component may not directly cause a system failure, but it may create conditions that make another failure more likely. A blocked filter may not stop the engine, but it may cause the pump to work harder, which increases the likelihood of pump failure. Traditional FMEA, with its focus on direct cause-and-effect relationships, does not capture these cascading effects.
The literature has recognized this limitation. A study on maritime risk analysis noted that the RPN is criticized for its "inability to analyze crashes with a common cause" and its "lack of direct and indirect relationships among failures and the causes." The hidden failure problem is related. A hidden failure is a failure that is not immediately evident to operations or maintenance personnel and that has the potential to prevent equipment from performing an on-demand function. A standby pump that has failed silently is a hidden failure. It does not cause a system failure until the primary pump fails, and then the hidden failure becomes apparent. Traditional FMEA struggles to analyze these scenarios because the failure mode is not a single event but a combination of events separated in time.
The Hidden Failure and Common Cause Problem
Hidden failures and common-cause failures are the two failure modes that most directly undermine the redundancy that DP systems and other safety-critical systems depend on. A hidden failure is a failure that is not evident until the system is called upon to perform its function. A common-cause failure is a failure that affects multiple redundant components simultaneously, defeating the redundancy that was intended to provide protection.
The IMO's MSC.1/Circ.1580 explicitly requires that FMEA consider hidden failures and common-cause failures. The classification societies implement this requirement in their rules. But analyzing these failure modes is difficult. A hidden failure may not be detected until a periodic test reveals it. A common-cause failure may be caused by a shared environmental condition, such as vibration, temperature, or electrical interference, that affects all redundant components equally. The FMEA team must identify these shared vulnerabilities and determine whether they could defeat the redundancy.
The difficulty is that hidden failures and common-cause failures are often not visible in the system's documentation. A single-line diagram shows redundant components as independent. It does not show the shared cable route that both components use, or the shared ventilation system that cools both, or the shared software module that controls both. The FMEA must uncover these hidden dependencies, and that requires a level of system knowledge that is not always available to the FMEA team.
Methods for Addressing the Limitations
The limitations of traditional FMEA have driven the development of a range of alternative and hybrid methods. These methods do not replace FMEA. They augment it, addressing specific weaknesses while preserving the structured analysis that makes FMEA useful.
Fuzzy logic is the most widely used approach. Fuzzy FMEA replaces the crisp 1-to-10 ratings with fuzzy numbers that represent ranges of possibility rather than precise values. An expert who is uncertain whether the occurrence of a failure mode is 3 or 4 can specify a fuzzy number that covers both possibilities. The fuzzy RPN is then calculated using fuzzy arithmetic, and the results are defuzzified to produce a ranking. A study on yacht fuel system safety used ordered weighted geometric averaging and generalized mixture operators to overcome the shortcomings of the traditional RPN, including its high duplication rates and its failure to consider ordered weight rules. A study on ship lubricating oil systems used fuzzy parameterized fuzzy soft matrices to capture uncertainties in expert opinions and dynamic operational conditions, finding that traditional RPN-FMEA "may not capture uncertainties in expert opinions and dynamic operational conditions."
The Analytic Hierarchy Process (AHP) is another widely used method. AHP allows decision-makers to assign weights to the RPN factors rather than assuming they are equally important. In a shipbuilding context, a yard might decide that severity should be weighted more heavily than detection, because a high-severity failure is more dangerous than a hard-to-detect low-severity failure. A study on risk mapping for an LCT 1500 DWT vessel in Jakarta used FMEA to identify high-risk failure modes and AHP to prioritize mitigation steps, finding that the combination provided a more complete risk picture than FMEA alone. A study on enhanced FMEA for marine machinery systems integrated fuzzy AHP and fuzzy TOPSIS, with the FAHP method refining the weight allocation for risk factors using expert judgment while accounting for uncertainty, and the FTOPSIS method ranking failure modes based on their proximity to ideal solutions.
Bayesian networks and machine learning represent the most recent evolution. The Cemre Shipyard study discussed in Chapter 7 used Random Forest regression to predict defect RPNs from historical data, achieving an R² of 0.9738. The Indonesian ferry study used Bayesian networks to update FMEA-derived risk priorities as construction progressed. These methods address the data scarcity problem by using the data that is available, and they address the subjectivity problem by grounding predictions in historical patterns rather than expert judgment alone.
The common thread across these methods is that they preserve the structure of FMEA while addressing its weaknesses. FMEA provides the framework: the breakdown of the system into components, the identification of failure modes, and the tracing of effects. The auxiliary methods provide the numerical rigor: the weighting, the uncertainty representation, and the data-driven updating. Neither is sufficient alone.
A Visual Illustration of the RPN Problem
The equal-weighting problem is best understood through an example. Consider three failure modes, each with different combinations of severity, occurrence, and detection but the same RPN.
Failure Mode A has high severity (9) but low occurrence (2). It is a failure that would be catastrophic if it happened, but it is unlikely. Failure Mode B has low severity (2) but high occurrence (9). It is a failure that happens often but does not cause much harm. Both have an RPN of 90. A shipyard that prioritizes by RPN alone would treat them as equally urgent. But a rational risk manager would prioritize Failure Mode A, because the consequences of it occurring are far more severe. The RPN, by treating severity and occurrence as interchangeable, obscures this distinction.
Failure Mode C has moderate values across all three factors and an RPN of 125, higher than both A and B. It would receive priority under a pure RPN ranking. But is it actually more urgent than Failure Mode A? A failure with severity 9 that occurs occasionally may pose a greater risk than a failure with severity 5 that occurs frequently, depending on the context. The RPN cannot answer that question. It can only provide a number.
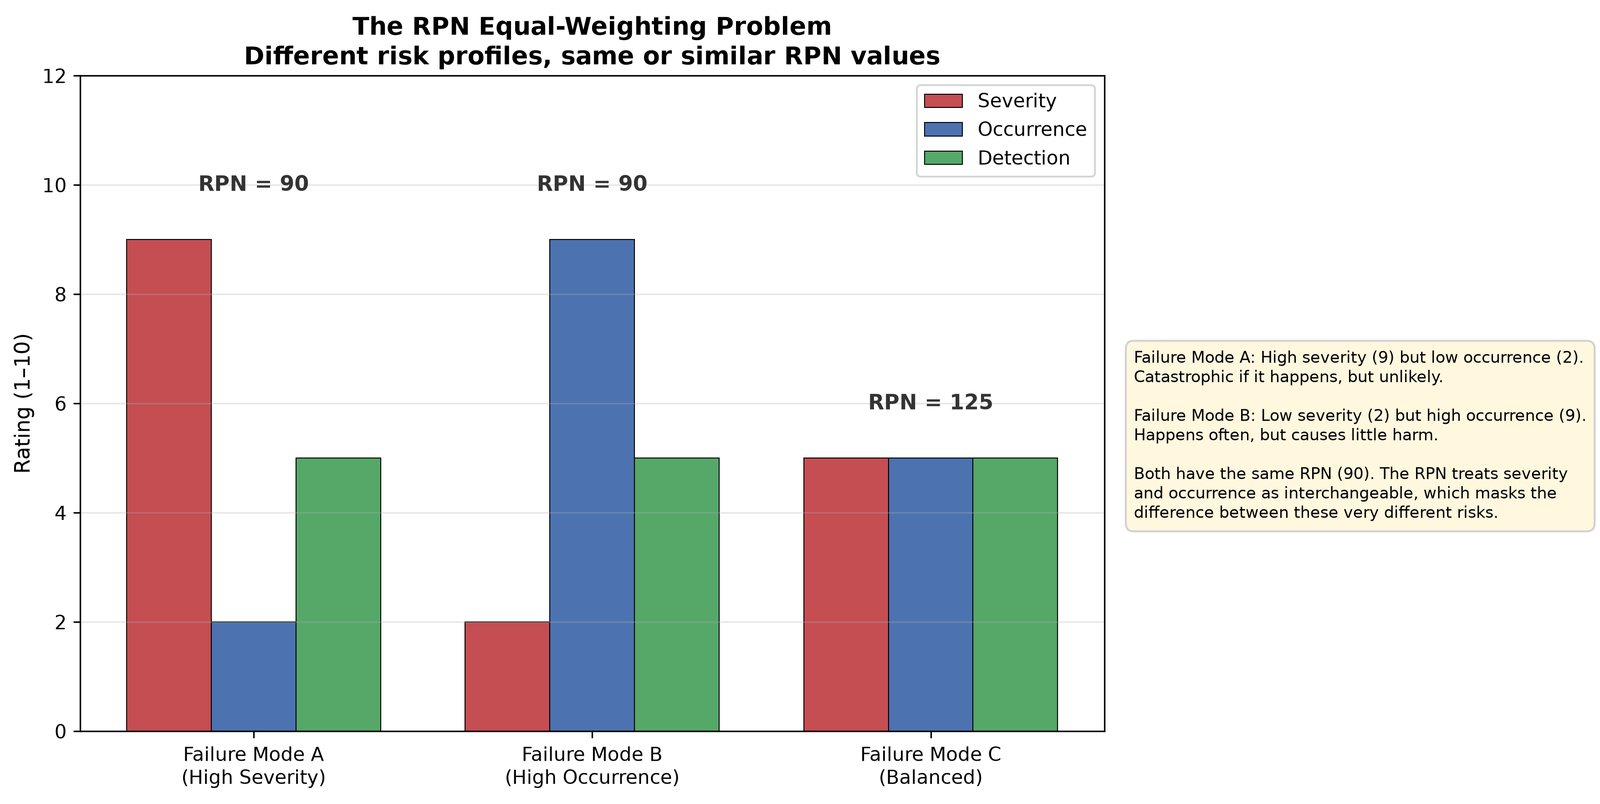
Chapter Summary
FMEA is a powerful tool, but it is not a perfect one. Its limitations are well documented in the maritime and manufacturing literature. The Risk Priority Number treats severity, occurrence, and detection as equally weighted, which can mis-prioritize failure modes. The ratings are subjective, and different teams may produce different results. Historical failure data is scarce, particularly for novel vessel types. Human error is difficult to analyze within a framework designed for hardware failures. Complex systems with non-linear interactions and hidden dependencies are not fully captured by component-level analysis.
The response to these limitations has been the development of hybrid methods. Fuzzy logic represents uncertainty explicitly. AHP allows the RPN factors to be weighted according to their relative importance. Bayesian networks and machine learning use historical data to update risk assessments as new information becomes available. These methods do not replace FMEA. They augment it, preserving its structured approach while addressing its weaknesses.
The most important limitation is not technical. It is organizational. A shipyard that treats FMEA as a documentation exercise will produce a document that satisfies a classification society but does not improve safety or quality. A shipyard that treats FMEA as a genuine inquiry into what could go wrong, and that invests in the data, the training, and the cross-functional communication that a good FMEA requires, will get more out of the method. The tool is only as good as the hands that use it.
Chapter 10: Future Directions – Data-Driven and Life-Cycle FMEA
From Document to Living Model
The FMEA that a shipyard produces today is almost always a document. It is written, reviewed, approved, and filed. It may be updated when the vessel is modified, but between those updates it sits inert. It does not learn. It does not adapt. It captures a snapshot of what the FMEA team knew at a particular moment in time, and it preserves that snapshot even as the world around it changes.
The future of FMEA in shipbuilding is the opposite of that. The emerging direction is toward a living model, one that is fed by real-time data, updated continuously, and integrated into the shipyard's production and quality systems. The FMEA does not stop when the document is filed. It continues to evolve as the vessel is built, commissioned, and operated. The data that flows from sensors, inspections, and maintenance records feeds back into the model, refining the probability estimates and sharpening the risk priorities. The model becomes more accurate over time, not less.
This chapter examines the technologies and methods that are driving this evolution. It covers the integration of FMEA with digital twins, the extension of FMEA across the full life cycle of a vessel, the use of artificial intelligence and machine learning for predictive risk management, the application of FMEA to autonomous ships and alternative fuels, and the challenges that must be overcome before these approaches become standard practice in shipyards.
Digital Twins and the FMEA Connection
A digital twin is a virtual replica of a physical asset that is updated with real-time data from sensors on the physical asset. In shipbuilding, a digital twin might be a model of the vessel's propulsion system, its power management system, or the entire ship. The model simulates the behavior of the physical system, and the sensor data keeps the simulation aligned with reality.
The connection between digital twins and FMEA is natural. A digital twin can simulate failure scenarios that would be dangerous or expensive to test on a real vessel. It can show what happens when a pump fails, a valve sticks, or a sensor drifts. FMEA identifies which failure scenarios are worth simulating. The digital twin runs the simulation and produces data on the consequences.
A study from the Korean Society of Marine Environment and Safety demonstrated this connection for electric propulsion vessels. The researchers performed FMEA to validate the redundancy of the electric power management system, using classification society redundancy FMEA standards as the basis. They then used a digital twin to simulate the system's response to single equipment failures under real vessel operating conditions. The FMEA identified the failure modes that the digital twin needed to simulate, and the digital twin provided the data needed to verify that the power management system's compensation functions would prevent primary and secondary damage. The study verified the improvement in propulsion conservation through tests.
The logic here is worth spelling out. Traditional FMEA relies on expert judgment to estimate the consequences of a failure. A digital twin replaces that judgment with simulation. Instead of asking "what do we think would happen if this pump failed?", the team can ask "what does the model show happens when this pump fails?" The answer is quantitative rather than qualitative. It can be expressed as a time to loss of propulsion, a temperature rise, a pressure drop, or any other measurable quantity.
The integration goes both ways. FMEA can guide the development of the digital twin itself. A study on FMEA-guided multi-fidelity modeling for digital twin-based fault detection proposed a framework where the fidelity of the digital twin model is selected based on the Risk Priority Numbers derived from FMEA. Failure modes with high RPNs are simulated with high-fidelity models that capture detailed physical behavior. Failure modes with low RPNs are simulated with low-fidelity models that run faster and require less computational resources. The FMEA determines where the digital twin needs to be precise and where it can be approximate.
This is a practical solution to a real problem. A full-fidelity digital twin of a ship's propulsion system would require enormous computational resources to run in real time. A multi-fidelity approach, guided by FMEA, allocates those resources where they matter most. The high-risk failure modes get the detailed simulation. The low-risk failure modes get a simplified treatment. The result is a digital twin that is both accurate and fast enough for real-time fault detection.
The Italian shipbuilder Fincantieri has applied digital twin technology at its Monfalcone shipyard to create virtual, data-driven replicas of cruise ships under construction. The digital twins integrate the Internet of Things, 3D modeling, and AI to optimize construction from design through production. Sensors on equipment and materials feed real-time data into the digital twin, enabling real-time monitoring of construction and simulation of assembly sequences. The digital twins are initiated in the design phase and used to plan and verify the assembly process, allowing for rapid and accurate assembly on the shop floor. This is not FMEA in the traditional sense, but it is the infrastructure on which a life-cycle FMEA would run. The digital twin provides the data. The FMEA provides the analytical framework.
Life-Cycle FMEA: From Design to Decommissioning
Traditional FMEA is performed at a specific point in time. A design FMEA is performed during design. A process FMEA is performed during production planning. The analysis is scoped to the phase in which it is conducted. It does not consider what happens to the system after the vessel enters service.
Life-cycle FMEA changes that. It applies the FMEA method across the entire life of the vessel, from concept design through construction, commissioning, operation, maintenance, and eventual decommissioning. The failure modes that matter in design may not be the same as the failure modes that matter in service. A component that is reliable when new may degrade over time. A maintenance procedure that works well in the shipyard may be impractical at sea. A life-cycle FMEA captures these phase-specific risks and ensures that they are addressed.
A framework developed at the Centre for Marine Technology and Engineering in Lisbon applies FMEA to the different phases of the ship life cycle, using the IMO's Formal Safety Assessment as the risk-based framework. The framework recognizes that the risk profile of a vessel changes as it moves through its life. During design, the dominant risks are those of incorrect specification or inadequate redundancy. During construction, the dominant risks are those of production defects and installation errors. During operation, the dominant risks are those of component degradation, human error, and environmental exposure. A life-cycle FMEA addresses all of these phases in an integrated way.
The practical value of life-cycle FMEA is most apparent when it is connected to operational data. A study on system reliability assessment of fully electric ships used an integrated FMEA–FTA–Bayesian network approach to assess the reliability of a 10,000 DWT-class electric bulk carrier. The study used the full life-cycle probability from the FMEA table, defined as the probability that a failure mode occurs at least once within the design or service life, as the input for the fault tree analysis. The Bayesian network was then used to update these probabilities as in-service evidence became available. This is the essence of life-cycle FMEA. The FMEA provides the initial probabilities. The operational data refines them. The model becomes more accurate as the vessel ages.
The IMCA code of practice on FMEA for DP vessels captures this principle clearly. It states that the FMEA must be viewed as a means of proving the redundancy concept of the vessel, and that it can only serve this purpose if it has been continuously reviewed and updated to include all changes and modifications to the vessel's systems throughout its life cycle. The FMEA is not a document that is produced once and filed away. It is a living record of the vessel's risk profile, and it must be maintained as the vessel changes.
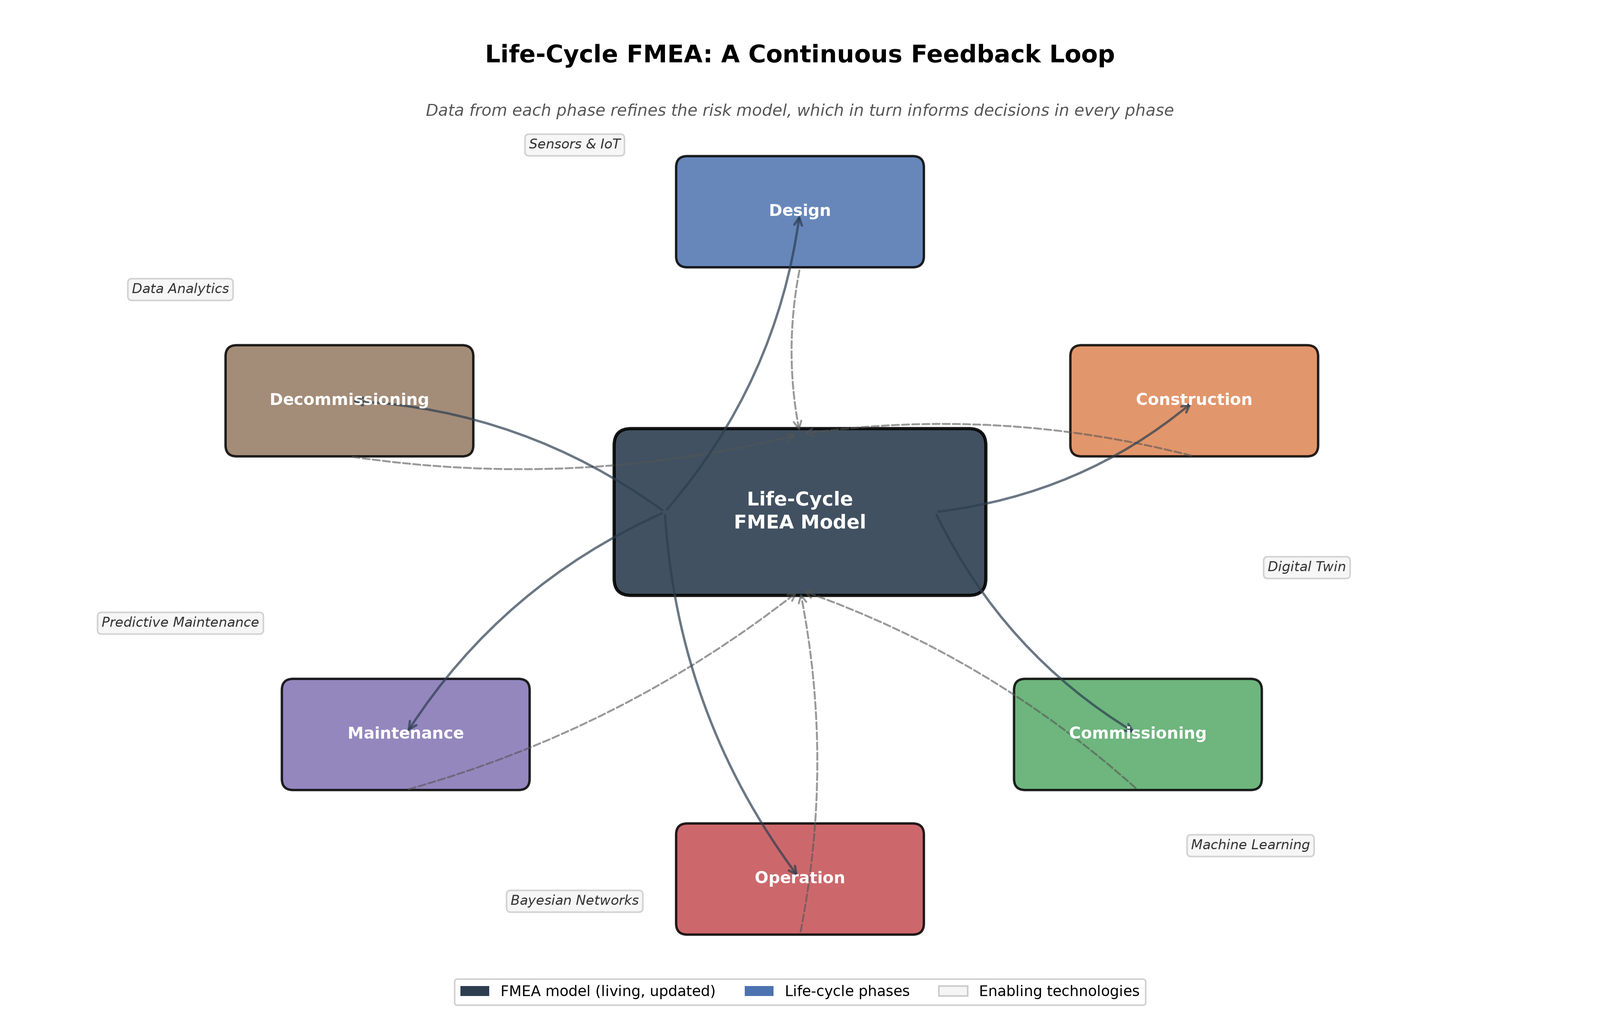
AI and Machine Learning: Predictive Risk Management
The Cemre Shipyard study discussed in Chapter 7 demonstrated that machine learning can predict defect RPNs with high accuracy from historical data. That study was a proof of concept. It showed that the approach works. The next step is to integrate it into the shipyard's operational systems so that predictions are generated in real time and fed back into production planning and quality control.
The study's authors framed this integration as a bridge between expert judgment and data-driven intelligence. The FMEA provides the structure and the domain knowledge. The machine learning model provides the scalability and the pattern recognition. The model can be integrated with enterprise systems for automated risk monitoring and continuous improvement. In practical terms, this means that every defect recorded in the shipyard's quality management system becomes training data for the model. The model updates its predictions. The updated predictions inform the next day's production planning. The cycle continues.
A similar approach is being explored for predictive maintenance in naval platforms. A project described in the NATO publications developed a technological demonstrator of AI techniques for predictive maintenance purposes, using FMECA data to predict the occurrence of different failure modes or abnormal operating conditions in a warship's propulsion engine. The FMECA provides the failure mode taxonomy. The AI model learns to recognize the patterns that precede each failure mode. The result is a system that can warn the crew before a failure occurs, rather than after.
The challenge with these approaches is data. A machine learning model needs data to learn. A shipyard that builds one or two vessels per year generates limited data. A vessel that operates for twenty years generates data continuously, but that data is often not collected in a structured way. The maritime industry has historically been slow to adopt data collection and analytics compared to other industries. A report from the National Shipbuilding Research Program in the United States identified the need to "provide a failure data readiness/quality assessment and develop a roadmap for government fleet owner/operators and shipyards" to unlock the power of failure and condition data sets through advanced analytics. The infrastructure for data-driven FMEA is being built, but it is not yet complete.
Autonomous Ships: New Failure Modes, New Analysis Methods
The development of maritime autonomous surface ships (MASS) is creating a new frontier for FMEA. An autonomous ship has failure modes that a conventional ship does not have. A software module can fail in ways that a hardware component cannot. A sensor can be spoofed or jammed. A communication link can be lost. A machine learning model can make an incorrect decision based on ambiguous input. Traditional FMEA, which was developed for hardware systems, does not naturally capture these failure modes.
The IMO adopted the MASS Code in 2024, providing the first international regulatory framework for autonomous ships. The code uses a goal-based approach: autonomous systems must achieve at least the same level of safety as conventional ships. This performance standard applies to navigation AI, collision avoidance, situational awareness, and emergency response systems. The code is expected to become mandatory through amendments to SOLAS, with entry into force targeted for 2028.
The classification societies have developed autonomous ship notations that supplement the IMO framework. DNV's rules for autonomous and remotely operated ships specify requirements for AI-based navigation, machine perception systems, decision-making algorithms, and remote control infrastructure. Lloyd's Register's ShipRight procedures require a structured safety case for each AI function, including hazard identification, FMEA of AI components, and simulation-based validation of AI performance across the operational design domain.
The research community is developing new FMEA methods for autonomous systems. A study on risk identification of autonomous ship software systems proposed a framework integrating Software FMEA, System-Theoretic Process Analysis (STPA), and Bayesian networks. The study noted that traditional risk assessment models "primarily focus on hardware failures, often overlooking potential software-related failures and functional inadequacies." The integration of Software FMEA with STPA addresses this gap by combining component-level failure analysis with system-level hazard analysis. The Bayesian network provides the mechanism for updating risk estimates as the system learns and adapts.
A separate study applied complex spherical fuzzy FMECA to assess the risks of MASS operations. The fuzzy approach was chosen to address "uncertainty and interrelated failure behaviours in multi-domain autonomous systems in maritime." The study found that the human-machine interface had the highest RPN, representing the most critical failure mode. This finding is significant. Even in an autonomous ship, the human-machine interface remains a critical failure point. The human may not be on board, but the human still interacts with the system, whether through remote control, mission planning, or emergency intervention. The interface must be designed to fail safely and to make failures visible to the operator.
Green Fuels: FMEA for Novel Energy Systems
The transition to alternative fuels is creating new failure modes that FMEA is uniquely suited to identify. Hydrogen, ammonia, methanol, and battery systems all introduce hazards that did not exist in conventional diesel vessels. Hydrogen has a wide flammability range and a low ignition energy. Ammonia is toxic and corrosive. Methanol burns with an invisible flame. Lithium-ion batteries can experience thermal runaway, a self-sustaining reaction that can be difficult to extinguish.
A study on the safety perspective for carbon-neutral ships examined the risks associated with these next-generation fuels and demonstrated how risks can be managed within the ALARP framework. The analysis showed that hydrogen poses an explosion risk, ammonia has toxicity and environmental impacts, and methanol poses an invisible flame risk. Each of these hazards requires a different set of failure mode analyses. The FMEA for a hydrogen system must consider seal leakage, pressure relief valve failure, hydrogen embrittlement, and inadequate ventilation. The FMEA for an ammonia system must consider release scenarios, toxicity exposure, and corrosion. The FMEA for a battery system must consider cell overheating, internal short circuits, and cooling failures.
The European Maritime Safety Agency has launched reports investigating the safety of hydrogen and ammonia as fuels in shipping, framing the safety hazards and identifying the failure modes that must be addressed. Research projects such as SAFe CRAFT are developing conceptual design studies for hydrogen and ammonia systems and conducting FMEA training sessions to build capability in the industry. The classification societies are developing rules for alternative-fuel vessels that require FMEA as part of the safety case.
The challenge with these novel fuels is the scarcity of failure data. Hydrogen fuel systems are not yet common enough to have generated meaningful historical failure rates. Ammonia engines are in the early stages of commercialization. Battery systems are more mature, but the failure modes of large marine battery installations are different from those of the smaller batteries used in electric vehicles. The FMEA for a novel fuel system must rely more heavily on expert judgment and simulation than on historical data. Digital twins and physics-based models can fill some of this gap by simulating failure scenarios that have not yet occurred in practice.
The Road Ahead: Challenges and Enablers
The vision of a life-cycle, data-driven FMEA is compelling. It is also difficult to implement. Several challenges must be addressed before it becomes standard practice in shipyards.
The first challenge is data infrastructure. A data-driven FMEA requires structured, high-quality data. A shipyard that records defects in narrative form or on paper cannot train a machine learning model. The Cemre Shipyard study was possible because the yard had a structured defect database with fields for cost, time loss, detection stage, and frequency. Many yards do not have this. Building the data infrastructure is a prerequisite for everything else.
The second challenge is integration. A life-cycle FMEA must connect the design office, the production floor, the quality department, and the vessel's operational systems. These are often separate organizations with separate data systems and separate priorities. The FMEA becomes a boundary object, a shared artifact that different groups use for different purposes. Making this work requires not just technical integration but organizational alignment. The Indonesian ferry study showed that different departments perceive risk differently. A life-cycle FMEA must accommodate those different perspectives without becoming fragmented.
The third challenge is verification and trust. A machine learning model that predicts failure risk is only useful if the shipyard trusts its predictions. Trust is built through validation. The Cemre study validated its model against historical data and reported an R² of 0.9738. But validation on historical data is not the same as validation in operation. The model must be tested on new data, and its predictions must be compared against actual outcomes. If the model is wrong, the shipyard needs to understand why and correct it. This requires a culture of continuous improvement and a willingness to treat the model as a tool rather than an oracle.
The fourth challenge is regulatory acceptance. Classification societies approve FMEA documents. They do not yet have a framework for approving a machine learning model that updates its predictions continuously. The IMO's Formal Safety Assessment framework provides a structure for risk-based decision-making, but it was not designed for adaptive models. The classification societies will need to develop new guidance for data-driven and life-cycle FMEA, addressing questions such as how often the model must be validated, what happens when the model's predictions change, and how the model's outputs are documented for class review.
These challenges are significant, but they are not insurmountable. The enablers are already in place. Digital twin technology is maturing. Machine learning tools are becoming more accessible. Classification societies are developing rules for autonomous ships and alternative fuels that require FMEA. The IMO's MASS Code establishes a goal-based framework that allows for innovation in risk assessment methods. The shipyards that invest in data infrastructure and build the organizational capability to use it will be well positioned to take advantage of these developments.
Chapter Summary
The future of FMEA in shipbuilding is data-driven and life-cycle oriented. Digital twins allow failure scenarios to be simulated rather than imagined, and they provide the computational platform for real-time fault detection. Life-cycle FMEA extends the analysis from design and construction into operation and maintenance, capturing the phase-specific risks that a static analysis misses. Machine learning and Bayesian networks use historical and operational data to update risk predictions, making the FMEA a living model rather than a static document.
Autonomous ships and alternative fuels are pushing the boundaries of what FMEA must analyze. Software failures, AI misclassifications, sensor spoofing, hydrogen leaks, ammonia releases, and battery thermal runaway are failure modes that traditional hardware-focused FMEA does not naturally capture. New methods, including Software FMEA, STPA, fuzzy FMECA, and integrated FMEA–FTA–Bayesian network approaches, are being developed to address these gaps.
The challenges are significant. Data infrastructure, organizational integration, model validation, and regulatory acceptance are all barriers that must be overcome. But the enablers are in place. The classification societies are developing rules that require FMEA for autonomous and alternative-fuel vessels. The IMO's MASS Code establishes a goal-based framework that allows for innovation. The shipyards that invest in data and organizational capability will be the ones that turn FMEA from a compliance exercise into a competitive advantage.
Chapter 11: Conclusion
What This Essay Has Shown
FMEA began as a military procedure for evaluating the reliability of equipment that could not be allowed to fail. It moved into aerospace, where the consequences of failure were measured in lives and mission success. It entered the automotive industry, where it evolved into a tool for improving quality and reducing warranty costs. And in the 1980s, it found its way into the maritime industry, driven by the need to prove that dynamic positioning systems could tolerate failures without losing station.
From that narrow beginning, FMEA spread across the shipbuilding process. It is now used in design offices to evaluate propulsion and electrical systems. It is used on the shop floor to analyze welding, block erection, and outfitting. It is used by classification societies to verify that redundancy requirements are met. It is used by shipyards to predict defect risk from historical data and by researchers to explore the failure modes of autonomous ships and alternative fuels.
The preceding chapters have traced this evolution through the published literature, case studies, and regulatory documents. They have shown that FMEA is not a single method but a family of methods, adapted to different phases, different systems, and different purposes. They have shown that the method has real limitations: the Risk Priority Number treats severity, occurrence, and detection as interchangeable; expert judgment introduces subjectivity; historical data is scarce for novel vessel types; human error is difficult to capture; and complex systems with non-linear interactions are not fully represented by component-level analysis. And they have shown that researchers and shipyards are developing hybrid methods, including fuzzy logic, AHP, Bayesian networks, and machine learning, to address these limitations.
The Thread That Runs Through
If there is a single thread that runs through all the applications and case studies examined in this essay, it is that FMEA works best when it is treated as an inquiry rather than a compliance exercise. A shipyard that performs FMEA because a classification society requires it will produce a document. A shipyard that performs FMEA because it genuinely wants to know what could go wrong will produce a safer, higher-quality vessel and will save money on rework, delays, and warranty claims.
The difference between the two is not the format of the FMEA or the software used to produce it. It is the quality of the team and the honesty of the discussion. The Turkish shipyard study that identified welding cable deformation and untidy cable placement as top risks did not find those failure modes by following a template. It found them by asking the people who do the work what makes their job harder and more dangerous. The Indonesian ferry study that revealed the divergent risk priorities of quality control, project leadership, and production management did not discover those differences by analyzing a database. It discovered them by talking to each group separately and comparing their answers. The Cemre Shipyard study that predicted defect RPNs with an R² of 0.9738 did not achieve that accuracy by applying a generic algorithm. It achieved it by building a structured defect database that captured cost, time loss, detection stage, and frequency for every defect.
The common ingredient in all of these successful applications is organizational commitment. FMEA requires time, expertise, and cross-functional communication. It requires a willingness to hear bad news and to act on it. It requires a culture in which a welder can tell an engineer that a design detail is unbuildable without fear of reprisal. These are not technical requirements. They are cultural ones, and they are often harder to establish than any analytical method.
The Evolution That Is Underway
FMEA is in the middle of a transition. The traditional method, based on expert judgment and static documents, is being augmented by data-driven approaches that use historical and operational data to update risk assessments continuously. Digital twins allow failure scenarios to be simulated rather than imagined. Machine learning models can predict defect risk from historical records. Bayesian networks can update risk priorities as construction progresses. Life-cycle FMEA extends the analysis from design and construction into operation and maintenance, creating a closed loop that feeds operational experience back into future designs.
This transition is being driven by three forces. The first is the increasing availability of data. Ships are instrumented with sensors that record temperature, pressure, vibration, and flow. Shipyards are digitizing their quality management systems. Classification societies are requiring more detailed documentation of failure modes and their effects. The raw material for data-driven risk assessment is becoming available.
The second force is the emergence of novel vessel types and fuels. Hydrogen, ammonia, methanol, and battery-electric propulsion introduce failure modes that have little or no historical precedent. Autonomous ships introduce software failures, sensor failures, and decision-making failures that traditional FMEA was not designed to analyze. The industry needs new methods for assessing these risks, and data-driven approaches are well suited to the task because they can learn from simulation and from early operational experience.
The third force is regulatory. The IMO's MASS Code establishes a goal-based framework for autonomous ships that allows for innovation in risk assessment methods. The classification societies are developing rules for alternative-fuel vessels that require FMEA as part of the safety case. The European Maritime Safety Agency is funding research into the safety of hydrogen and ammonia as fuels. The regulatory environment is pushing the industry toward more rigorous, more data-driven risk assessment.
What Remains to Be Done
The transition is not complete. Several gaps remain.
The first gap is data infrastructure. A machine learning model needs structured, high-quality data. Many shipyards do not have it. Defects are recorded in narrative form or on paper. Failure rates are estimated from memory rather than measured from records. The Cemre Shipyard study was possible because that yard had a structured defect database. Many yards do not. Building the data infrastructure is a prerequisite for everything else, and it requires investment in software, training, and data discipline.
The second gap is integration. A life-cycle FMEA must connect the design office, the production floor, the quality department, and the vessel's operational systems. These are often separate organizations with separate data systems and separate priorities. The Indonesian ferry study showed that different departments perceive risk differently. A life-cycle FMEA must accommodate those different perspectives without becoming fragmented. This requires not just technical integration but organizational alignment.
The third gap is verification and trust. A machine learning model that predicts failure risk is only useful if the shipyard trusts its predictions. Trust is built through validation. The Cemre study validated its model against historical data. But validation on historical data is not the same as validation in operation. The model must be tested on new data, and its predictions must be compared against actual outcomes. If the model is wrong, the shipyard needs to understand why and correct it. This requires a culture of continuous improvement and a willingness to treat the model as a tool rather than an oracle.
The fourth gap is regulatory. Classification societies approve FMEA documents. They do not yet have a framework for approving a machine learning model that updates its predictions continuously. The IMO's Formal Safety Assessment framework provides a structure for risk-based decision-making, but it was not designed for adaptive models. The classification societies will need to develop new guidance for data-driven and life-cycle FMEA, addressing questions such as how often the model must be validated, what happens when the model's predictions change, and how the model's outputs are documented for class review.
The Human Element
Amid all the discussion of algorithms, digital twins, and Bayesian networks, it is worth remembering that FMEA is ultimately a human activity. The data does not analyze itself. The model does not ask the right questions. The algorithm does not know which failure modes matter. Those things come from people: from the engineer who understands the system, from the foreman who knows how it is built, from the welder who knows where the problems hide, from the surveyor who knows what the regulations require.
The most sophisticated data-driven FMEA in the world will fail if the people who use it do not trust it, do not understand it, or do not act on its findings. The most basic paper-based FMEA will succeed if the team that performs it is honest, thorough, and committed to acting on what they find. The method matters. The data matters. The tools matter. But the people matter most.
This is not a new insight. It is the same insight that has driven every successful application of FMEA since the method was first formalized in 1949. The tool has changed. The data has changed. The regulatory environment has changed. The human element has not.
A Closing Thought
A ship is a machine that must work in the most unforgiving environment on earth. It must withstand storms, corrosion, fatigue, and the cumulative effects of thousands of small decisions made during its construction. A defect that is invisible at the shipyard can become a catastrophe at sea. A failure mode that no one considered can become the cause of a disaster.
FMEA is the discipline of considering the unconsidered. It is the practice of asking "what could go wrong?" before anything has gone wrong, and of taking the answers seriously. In an industry where the cost of failure is measured in lives and livelihoods, that discipline is not optional. It is essential. The methods will continue to evolve. The tools will become more sophisticated. The data will become more abundant. But the fundamental question will remain the same: what could fail here, and what would happen if it did? The shipyards that keep asking that question, and that act on the answers, will be the ones that build the safest ships.
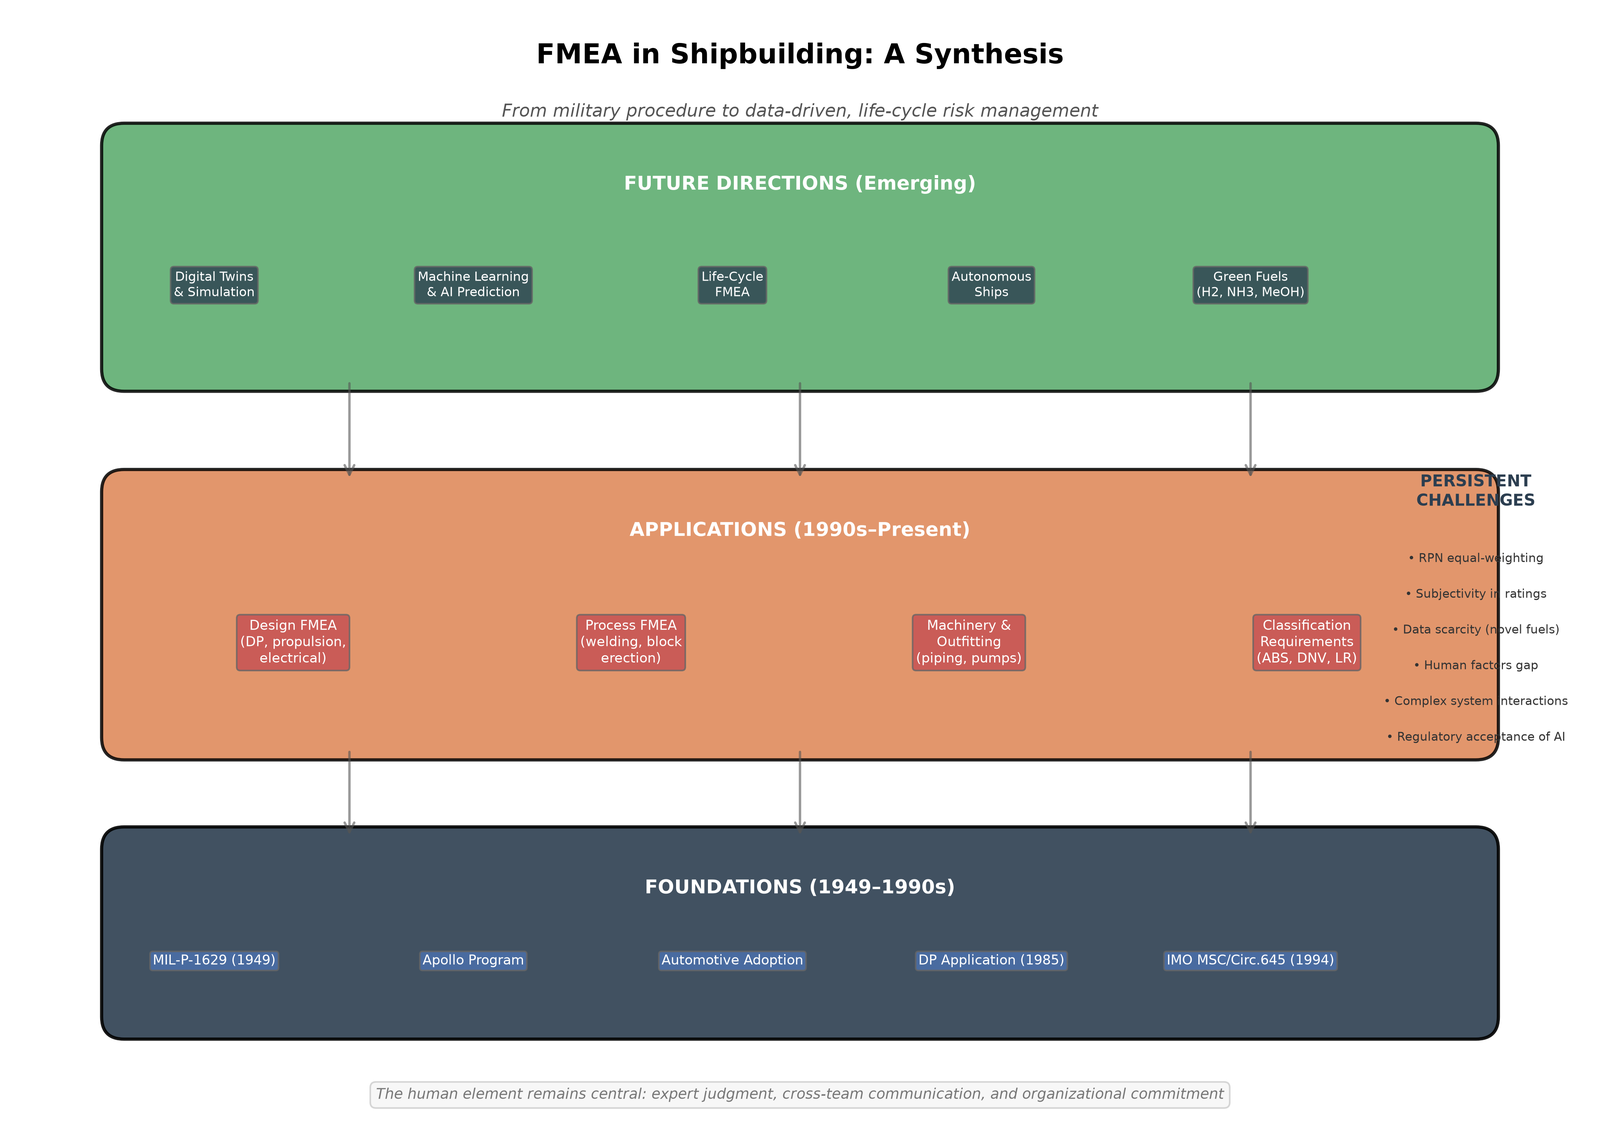
References
- American Bureau of Shipping. (2021). Guide for dynamic positioning systems. ABS.
- Ariany, Z., Pitana, T., & Vanany, I. (2023). Risk assessment of new ferry ship construction in Indonesia using the Failure Mode Effect and Analysis (FMEA) method. Journal of Applied Engineering Science, 21(3), 872–883. https://doi.org/10.5937/jaes0-43711
- Ariany, Z., Pitana, T., & Vanany, I. (2024). Integration of FMEA and Bayesian network methods for risk assessment of components delay in ferry ship construction. EUREKA, Physics and Engineering, 2024(1), 93–104. https://doi.org/10.21303/2461-4262.2024.002976
- Cemre Shipyard. (n.d.). Entegre yönetim sistemi kapsamı [Integrated management system scope]. Cemre Shipyard.
- Crispim, J., Fernandes, J., & Rego, N. (2020). Customized risk assessment in military shipbuilding. Reliability Engineering & System Safety, 197, 106809.
- da Silva Junior, M. E., Lira, I., Siqueira, A., Gomes, C., Braga, E., Costa, J. E. B., Pontes, L., Freire, M. R., Carvalho, V., Oliveira, W. A. L., Carneiro, I., & Barretto, T. (2017). Application of the processes failures modes effects analysis technique (PFMEA) to the naval pipe manufacturing process. In Proceedings of the 24th ABCM International Congress of Mechanical Engineering. Curitiba, Brazil.
- DNV GL. (2018). Rules for classification: Ships, Part 6 Additional class notations, Chapter 3 Navigation, manoeuvring and position keeping. DNV GL.
- Ibazebo, E., Savsani, V., Siddhpura, A., & Siddhpura, M. (2025). Enhanced failure mode effect analysis methodology in the risk assessment of marine machinery systems. In Proceedings of the ASME 2025 International Mechanical Engineering Congress and Exposition. Montreal, QC, Canada.
- Ibazebo, E., Savsani, V., Siddhpura, A., & Siddhpura, M. (2025). Failure mode and effect analysis in the risk assessment of the main engine system of an anchor handling tug supply vessel. Proceedings of the ASME 2024 International Mechanical Engineering Congress and Exposition, 11, V011T14A017. https://doi.org/10.1115/IMECE2024-145426
- International Marine Contractors Association. (2019). Code of practice on failure modes and effects analysis (FMEA). IMCA.
- International Maritime Organization. (2017). MSC.1/Circ.1580: Guidelines for vessels and units with dynamic positioning (DP) systems. IMO.
- Kwon, S.-M., Yang, Y.-S., & Shin, C.-H. (2000). Quality assessment of hatchway using QFD & FMEA. Journal of the Society of Naval Architects of Korea, 37(3), 78–89.
- Lloyd's Register. (2021). Rules and regulations for the classification of ships, Part 7, Chapter 4: Dynamic positioning systems. Lloyd's Register.
- Ozkok, M. (2014). Risk assessment in ship hull structure production using FMEA. Journal of Marine Science and Technology, 22(2), 173–185. https://doi.org/10.6119/JMST-013-0222-1
- Republic of Türkiye Ministry of Labour and Social Security. (n.d.). Application of FMEA to welding process in shipyards. Retrieved from https://www.csgb.gov.tr
- Wang, J., Ma, Y., Bao, Y., & Ji, X. (2026). Application review on FMEA/FMECA in marine engineering. Journal of Traffic and Transportation Engineering, 2026(1), 158–175. https://doi.org/10.19818/j.cnki.1671-1637.2026.057
- Yilmaz, A. F., & Kose, O. (2025). Advancing sustainable shipbuilding through a hybrid risk prioritization model: Integrating FMEA and machine learning. Sustainable Materials and Technologies.
- Yoon, K., & Kim, J. (2021). FMEA of electric power management system for digital twin technology development of electric propulsion vessels. Journal of the Korean Society of Marine Environment & Safety, 27(7), 10. https://doi.org/10.7837/kosomes.2021.27.7.10
- Zhou, X., et al. (2025). Fuzzy parameterized fuzzy soft matrices-based failure mode and effects analysis (FPFS-FMEA) with ship lubricating oil system risk assessment. Ocean Engineering.
- Zhou, X., et al. (2025). Quantitative risk assessment of cruise ship turbochargers using type-2 fuzzy-FMECA and dynamic Bayesian network approach. Applied Soft Computing, 182, 113568.